Solana’s next price paths: bull and bear scenarios
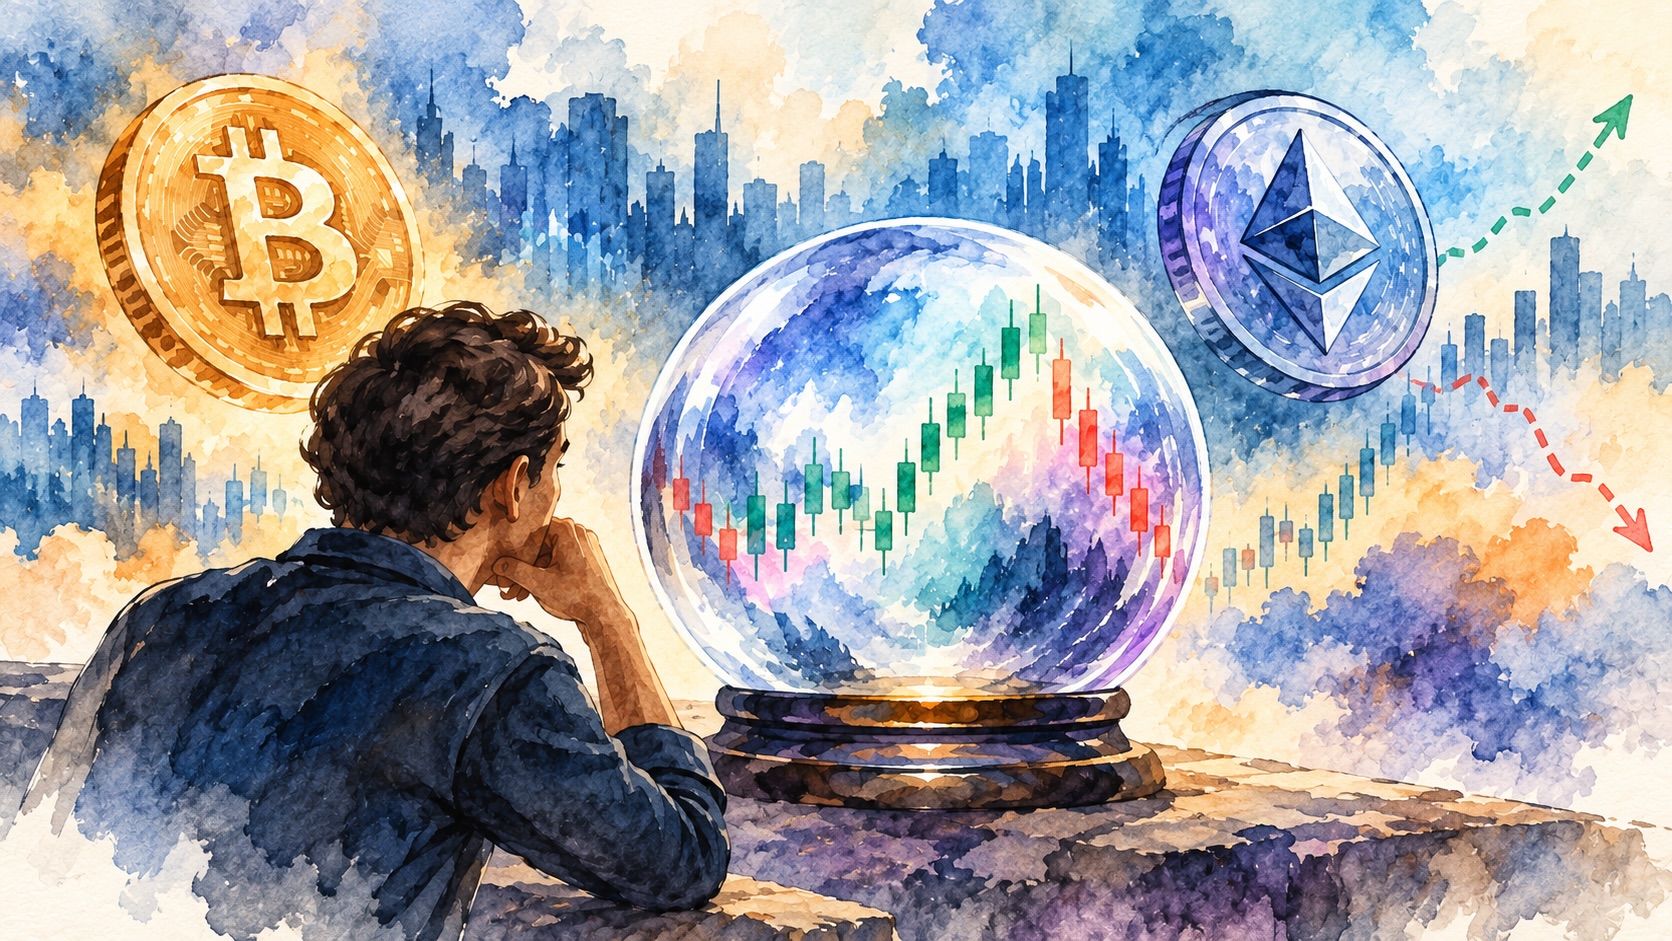
Forbes outlines two near-term paths for Solana: a rally if buyers lift SOL and on-chain activity improves, or a slide if supports break and network use falls.
Solana’s near-term price direction depends on market action and on-chain activity. Traders and investors are watching technical levels, network metrics and broader crypto trends to judge whether SOL will push higher or move lower.
The bullish scenario would require buyers to push SOL above recent resistance and keep it above short-term moving averages. A sustained rally in Bitcoin and wider risk-on sentiment in crypto markets would support further gains. On-chain signs that coincide with higher prices would include rising daily active addresses, increased transaction volume and fees, higher total value locked in Solana-based DeFi projects, and steady or growing staking participation that reduces circulating supply. Improvements in network performance and reliability, and launches or upgrades from major decentralized applications, would be additional market signals.
The bearish scenario would follow a failure to defend key support levels and a drop in trading activity. A fall in Bitcoin or a broader shift toward risk-off assets could trigger leveraged positions to unwind and push SOL lower. Repeated network outages or performance problems would likely reduce user activity and developer confidence, lowering transaction counts and TVL. Large token sales by major holders, scheduled token unlocks, or sharp inflows to exchanges could increase selling pressure. On derivatives markets, negative funding rates and rising short open interest have coincided with rapid downside moves.
Market structure and liquidity will influence how price moves unfold. Thin order books at key price bands can lead to fast swings, while deeper liquidity can absorb selling or buying pressure and slow reversals. Macro factors such as equity market trends and central bank policy can affect investor appetite for crypto assets and so influence SOL’s path.
Practical indicators to monitor include exchange flows and net deposits, changes in DeFi TVL and the number of active programs on Solana, daily transaction counts and average fees, staking rates and the percentage of SOL locked by validators, and funding rates and open interest in futures markets. These metrics provide direct measures of user demand, developer activity and leverage in derivatives.
Potential catalysts include protocol upgrades, successful application launches that increase network use, and institutional developments such as new exchange listings or investment products that broaden access to SOL. Negative catalysts include high-profile outages, security incidents affecting major projects, and regulatory actions that raise uncertainty.
Solana launched in 2020 as a high-throughput blockchain designed for fast, low-cost transactions and has developed an ecosystem of wallets, DeFi projects and NFT marketplaces. The network’s history includes periods of rapid growth alongside episodes of congestion and downtime. SOL functions as both a fee token and a staking asset, linking its price to network demand and staking activity.
Near-term movement will reflect a mix of technical price action, on-chain activity and broader market conditions. Monitoring the metrics and events described above can help show which of the two scenarios is unfolding.
The material on GNcrypto is intended solely for informational use and must not be regarded as financial advice. We make every effort to keep the content accurate and current, but we cannot warrant its precision, completeness, or reliability. GNcrypto does not take responsibility for any mistakes, omissions, or financial losses resulting from reliance on this information. Any actions you take based on this content are done at your own risk. Always conduct independent research and seek guidance from a qualified specialist. For further details, please review our Terms, Privacy Policy and Disclaimers.
Articles by this author