Market sentiment definition: the pulse of investor confidence
Market sentiment influences real trades across crypto, stocks, and other assets. It shows how prices react to shifting expectations, even if actual events haven’t happened yet.
On this page
- What is market sentiment in trading, and why does it matter
- The hidden role of investor mood in price action
- Trading strategies based on market sentiment
- Contrarian approach: moving against the crowd
- Social sentiment scraping: reading online mood swings
- Momentum riding during strong sentiment trends
- Option activity and liquidations: reading market pressure
- Common indicators for tracking market sentiment
- Volatility Index (VIX): measuring investor fear levels
- What the High-Low Index tells us about investor confidence
- How the Bullish Percent Index (BPI) measures market strength
- Combining moving averages with sentiment analysis
In simple terms, market sentiment reflects how confident or fearful investors feel about the market. Understanding these trends can help investors make more informed decisions. Below, we’ll break down what market sentiment is and how reading the market’s mood can help in trading.
What is market sentiment in trading, and why does it matter
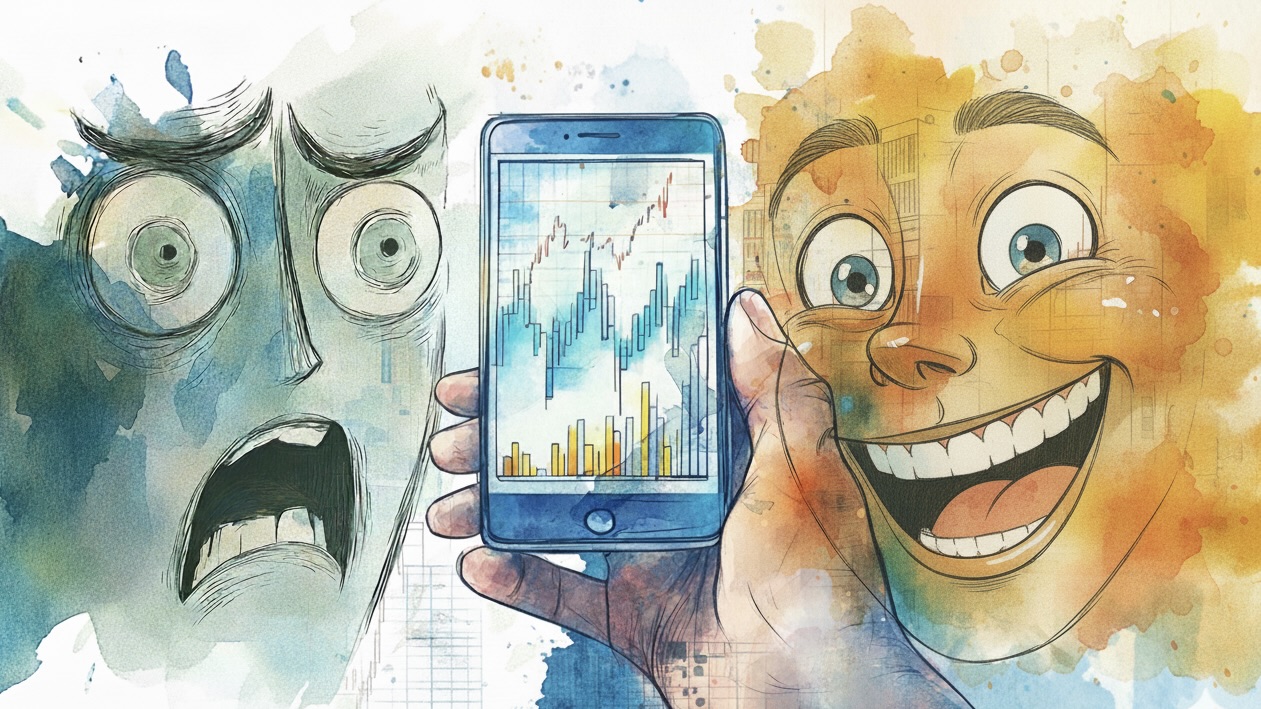
Market sentiment reflects the overall mood or attitude of investors toward a particular market or asset. It’s what drives price movements beyond fundamentals. If most traders feel optimistic, prices tend to rise – that’s called bullish sentiment. When fear or pessimism dominates, you get bearish sentiment. The market sentiment meaning ties directly into what is investor sentiment – it’s essentially the collective psychology of market participants. Even solid data can be ignored if emotions like greed or fear take over.
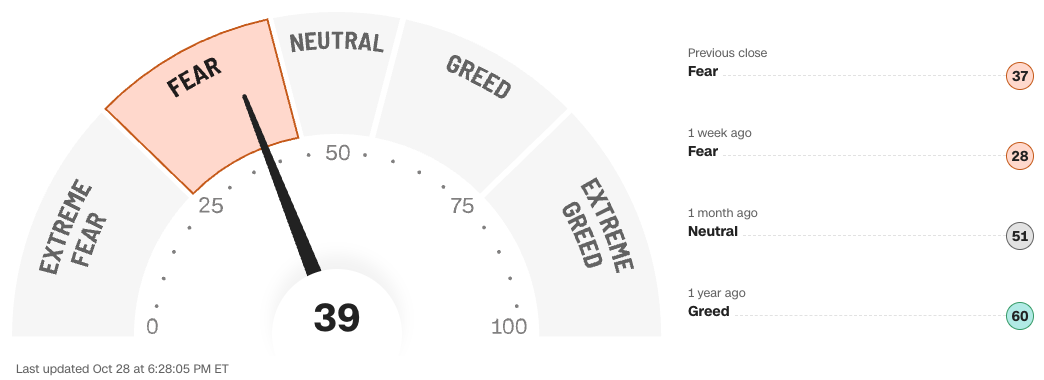
The crypto market shows this as well: a single piece of news – such as a regulatory update, central bank comment, or global trade policy development – can shift sentiment overnight. Emotional forces like FOMO (Fear of Missing Out) and FUD (Fear, Uncertainty, and Doubt) shape behavior in real time. These emotions often align with signals from the Fear & Greed Index, a popular gauge of investor mood. Traders also track other sentiment indicators – such as put–call ratios or even social media mentions – to gauge where the crowd stands.
Market sentiment is important because collective investor behavior directly influences market movements. If enough people believe prices will rise, they buy – pushing prices up. Understanding sentiment helps investors anticipate these shifts and avoid emotional decisions.
So, while it’s not an exact science, reading market sentiment is crucial for timing entries, managing risk, and recognizing when the market might be running on emotion rather than logic.
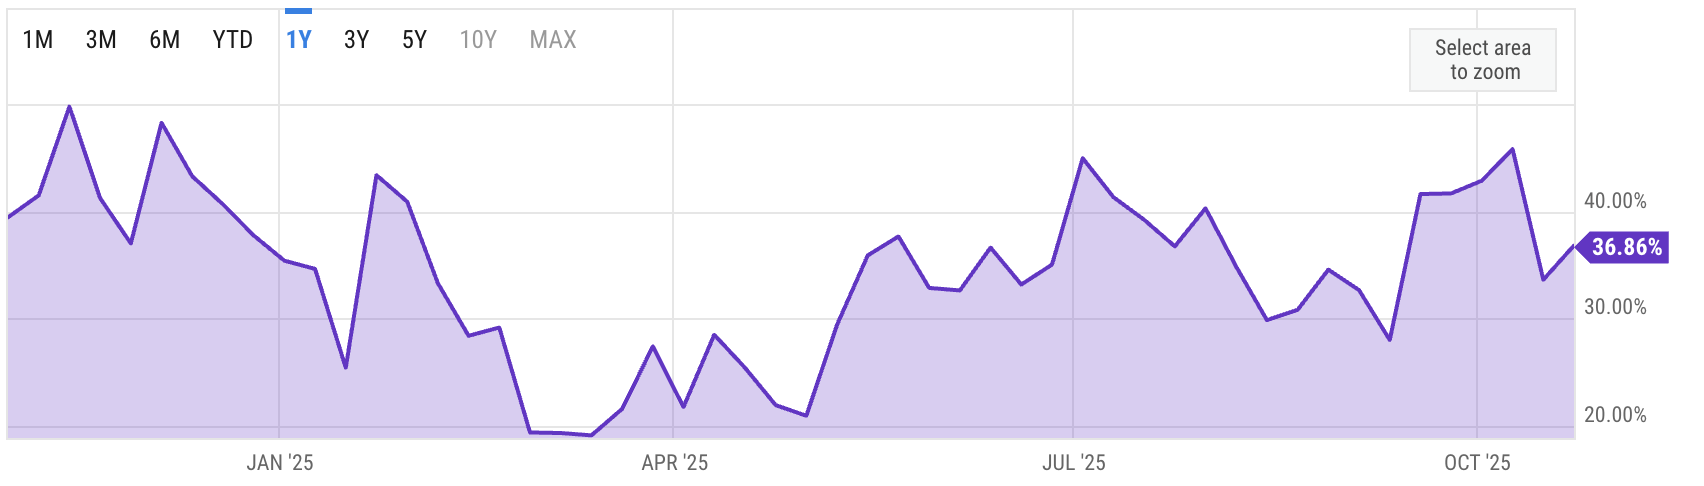
Several surveys and analytics tools track investor sentiment to help gauge market mood and potential price movements. For example, the American Association of Individual Investors (AAII) survey collects data on how bullish, bearish, or neutral investors feel about stocks, providing insights into the collective psychology that can drive market trends. The chart below from YCharts visualizes these trends over time.
The hidden role of investor mood in price action
If we look at the market sentiment definition, it’s the overall attitude of investors toward a market or specific asset. When optimism dominates, people buy aggressively, pushing prices higher. When fear takes over, they sell, and prices drop
Investor mood can create feedback loops. For example, a positive earnings season or upbeat economic data can make investors more confident, attracting new buyers. But negative headlines or uncertainty can flip that sentiment fast.
Those emotional reactions often show up in extreme scenarios, like these:
- Panic selling: triggered by sudden bad news, causing investors to dump assets en masse and accelerate declines.
- FOMO (Fear of Missing Out): during bull runs, traders rush to buy simply because others are profiting, pushing prices beyond fair value.
- Profit-taking: after strong rallies, investors may sell to lock in gains, cooling off markets.
- Market euphoria: excessive optimism can inflate bubbles when everyone believes prices will only rise.
Knowing what is market sentiment won’t turn you into a market mind reader, but it can help you stay rational when the crowd loses its head.
Trading strategies based on market sentiment
Market sentiment analysis is where the money’s made or lost in the short term. There can be perfect fundamentals, but if the crowd’s panicking, the value of an asset, like a stock or crypto asset, is going down. Investor sentiment meaning in the context changes daily; one day it can be optimism on Federal Reserve interest rate cuts, the next the market may dip on the grounds of economic challenges.
Traders can use market sentiment as part of their strategy, but its value lies in acting before the broader market reacts. Below are some popular strategies based on market sentiment analysis.
Contrarian approach: moving against the crowd
Markets tend to move to extremes, creating opportunities for contrarian traders. The key is going against the crowd. When panic sets in and everyone’s selling, that’s often the best time to buy. Conversely, during periods of euphoria and rising prices, it may be time to take profits. The Fear & Greed Index highlights these sentiment extremes: readings of extreme fear indicate oversold conditions, while extreme greed, especially alongside media hype and bullish chatter, often signals a market top.
Social sentiment scraping: reading online mood swings
Online platforms like Reddit, X (Twitter), and Telegram can magnify investor sentiment in real time. Social sentiment tools, including LunarCrush and Santiment, quantify these trends to identify assets attracting attention before the broader market reacts. Not all hype translates into profitable trades; according to Kraken, 85% of investors relying on social media as a source of investor information later regretted their decisions. Effective social arbitrage requires separating genuine signals from noise, evaluating engagement quality and volume, and avoiding overreactions.
Momentum riding during strong sentiment trends
Momentum traders follow the prevailing market sentiment rather than going against it. When bullish or bearish sentiment aligns with rising price and volume, it often signals a trend continuation. By combining technical indicators with sentiment data, traders can enter early and ride the momentum before it fades. For example, a surge in positive social media chatter or widespread bullish coverage of a stock or crypto asset, alongside increasing price and volume, may indicate early-stage FOMO. Momentum traders use these signals to confirm trends and position themselves ahead of the crowd.
Option activity and liquidations: reading market pressure
The options market and liquidation data can reveal how investors are feeling about an asset. Large numbers of call options (bets that the price will rise) suggest optimism, while many put options (bets that the price will fall) indicate caution. In fast-moving markets, extreme sentiment can trigger liquidations, where leveraged positions are automatically closed because investors can’t meet margin requirements. For example, a sudden drop in price during a bullish frenzy can force traders to sell, pushing prices down. Traders interpret these signals differently: contrarian traders act against extremes, buying when fear is high or selling during euphoria, while momentum traders follow trends, sometimes using hedges to manage the risk of sudden liquidations.
Common indicators for tracking market sentiment
Traders don’t just guess market sentiment – they track it using indicators that gauge investor mood in real time, offering a snapshot of the market’s current emotional state.
Volatility Index (VIX): measuring investor fear levels
The VIX measures expected 30-day volatility in the S&P 500 using options prices. Think of it as the market’s “fear thermometer” – higher values mean more panic, lower values mean calm. When the VIX is low (under 15), investors are relaxed, and overconfidence can sometimes precede market corrections. When it’s high (over 30), fear dominates. Traders use the VIX for risk management, adjusting position sizes, setting stop losses, and hedging portfolios. While the VIX is for stocks, crypto has similar tools. Deribit’s volatility index, DVOL, for example, acts like a “VIX for crypto,” measuring expected volatility for Bitcoin and other cryptocurrencies.
What the High-Low Index tells us about investor confidence
The High-Low Index is a tool used only for stocks, showing how many are hitting 52-week highs compared to 52-week lows. It helps traders gauge whether the market is strong and optimistic or weak and cautious. In crypto, there isn’t a direct equivalent because markets operate 24/7, so the standard “52-week high/low” framework doesn’t apply. However, similar measures exist: the Crypto Fear & Greed Index tracks overall market mood, Bitcoin dominance shows market concentration, and on-chain data such as active addresses or fund flows indicate how broadly investors are participating.
How the Bullish Percent Index (BPI) measures market strength
The BPI shows what percentage of stocks in a group (like the S&P 500) are in strong uptrends. Above 70% means the market is very strong – almost everyone’s winning. Below 30% means most stocks are weak – time to be careful. Traders use BPI to confirm trend health, avoid buying in overbought conditions, and spot potential reversals in major indices.
Combining moving averages with sentiment analysis
Moving averages show the average price of an asset over a set period, helping traders see the overall trend and avoid reacting to small daily swings. When combined with sentiment analysis – like the market’s mood, fear, or optimism – traders get a clearer picture. For example, if the price is above its moving average and sentiment is positive, it can confirm an uptrend. If sentiment is negative despite a rising trend, it may warn of a possible reversal. This combination helps traders make smarter decisions and avoid emotional mistakes.
The material on GNcrypto is intended solely for informational use and must not be regarded as financial advice. We make every effort to keep the content accurate and current, but we cannot warrant its precision, completeness, or reliability. GNcrypto does not take responsibility for any mistakes, omissions, or financial losses resulting from reliance on this information. Any actions you take based on this content are done at your own risk. Always conduct independent research and seek guidance from a qualified specialist. For further details, please review our Terms, Privacy Policy and Disclaimers.
Articles by this author