Custom Indicators for Crypto’s Liquidation-Driven Volatility

Standard oscillators lag during rapid market flushes because they rely on bar-close calculations. Discover how multi-timeframe regime-detection scripts address candle latency and data errors during crypto liquidation cascades.
The September 11, 2026 liquidation cascade exposed a structural weakness in conventional crypto indicators: oscillators are calculated on completed bars, while forced liquidations can accelerate within minutes. The episode is a useful case study in why some traders build multi-timeframe regime-detection scripts to tell a cascade-driven flush from a genuine trend shift.
Standard indicators track history, not liquidation velocity
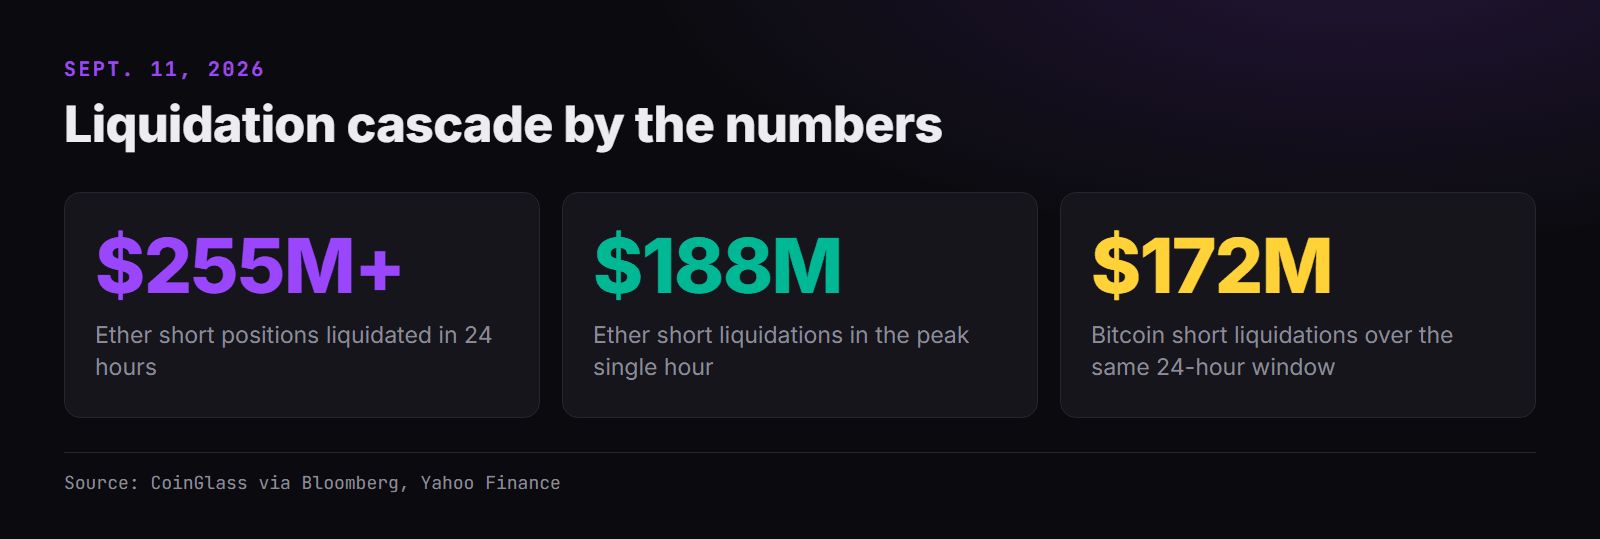
On September 11, Ether short liquidations exceeded $255 million over 24 hours, with approximately $188 million concentrated in a single hour, according to CoinGlass data reported by Bloomberg. Bitcoin short liquidations reached roughly $172 million over the same window. The move drew comparisons to a late-August short-squeeze wave that produced the largest Bitcoin short-liquidation wave in records cited back to 2021.
A standard RSI or ATR calculation running on a 15-minute or 1-hour chart cannot confirm a reversal until the bar closes, introducing a minimum lag equal to the remainder of the candle plus the indicator’s lookback period. During the September 11 event, a 1-hour RSI would have needed up to 60 minutes to register the shift, while the liquidation wave had already peaked and subsided. The disconnect between chart resolution and market velocity is not hypothetical—it is a recurring pattern in leveraged markets.
Consider the mechanics: a 1-hour RSI publishes one value per closed bar. If the liquidation flush hits 10 minutes into a new hour, the indicator cannot react for at least 50 minutes. By then the forced positions are closed, and the indicator is describing a move that no longer exists. That same structural lag applies to any single-timeframe oscillator, regardless of the symbol.
The lag problem, from bar-close dependency to NaN propagation
Fast markets also expose data-quality problems. When an exchange feed stalls or a request returns nothing, most scripting environments produce empty values that cascade through arithmetic and distort a series unless they are handled explicitly. Replacing gaps with zeros can create artificial returns or volume spikes when the feed catches up after a forced liquidation event.
The safer habit is to make gap handling a visible decision in the code: decide for each input whether a missing value is skipped, carried forward from the last valid print, or treated as zero, and keep that choice in one place where it can be reviewed. During a cascade, when a few seconds of delayed ticks can decide whether an indicator registers a flush or a false signal, that choice can matter as much as the formula itself.
Multi-timeframe scripting fills the gap
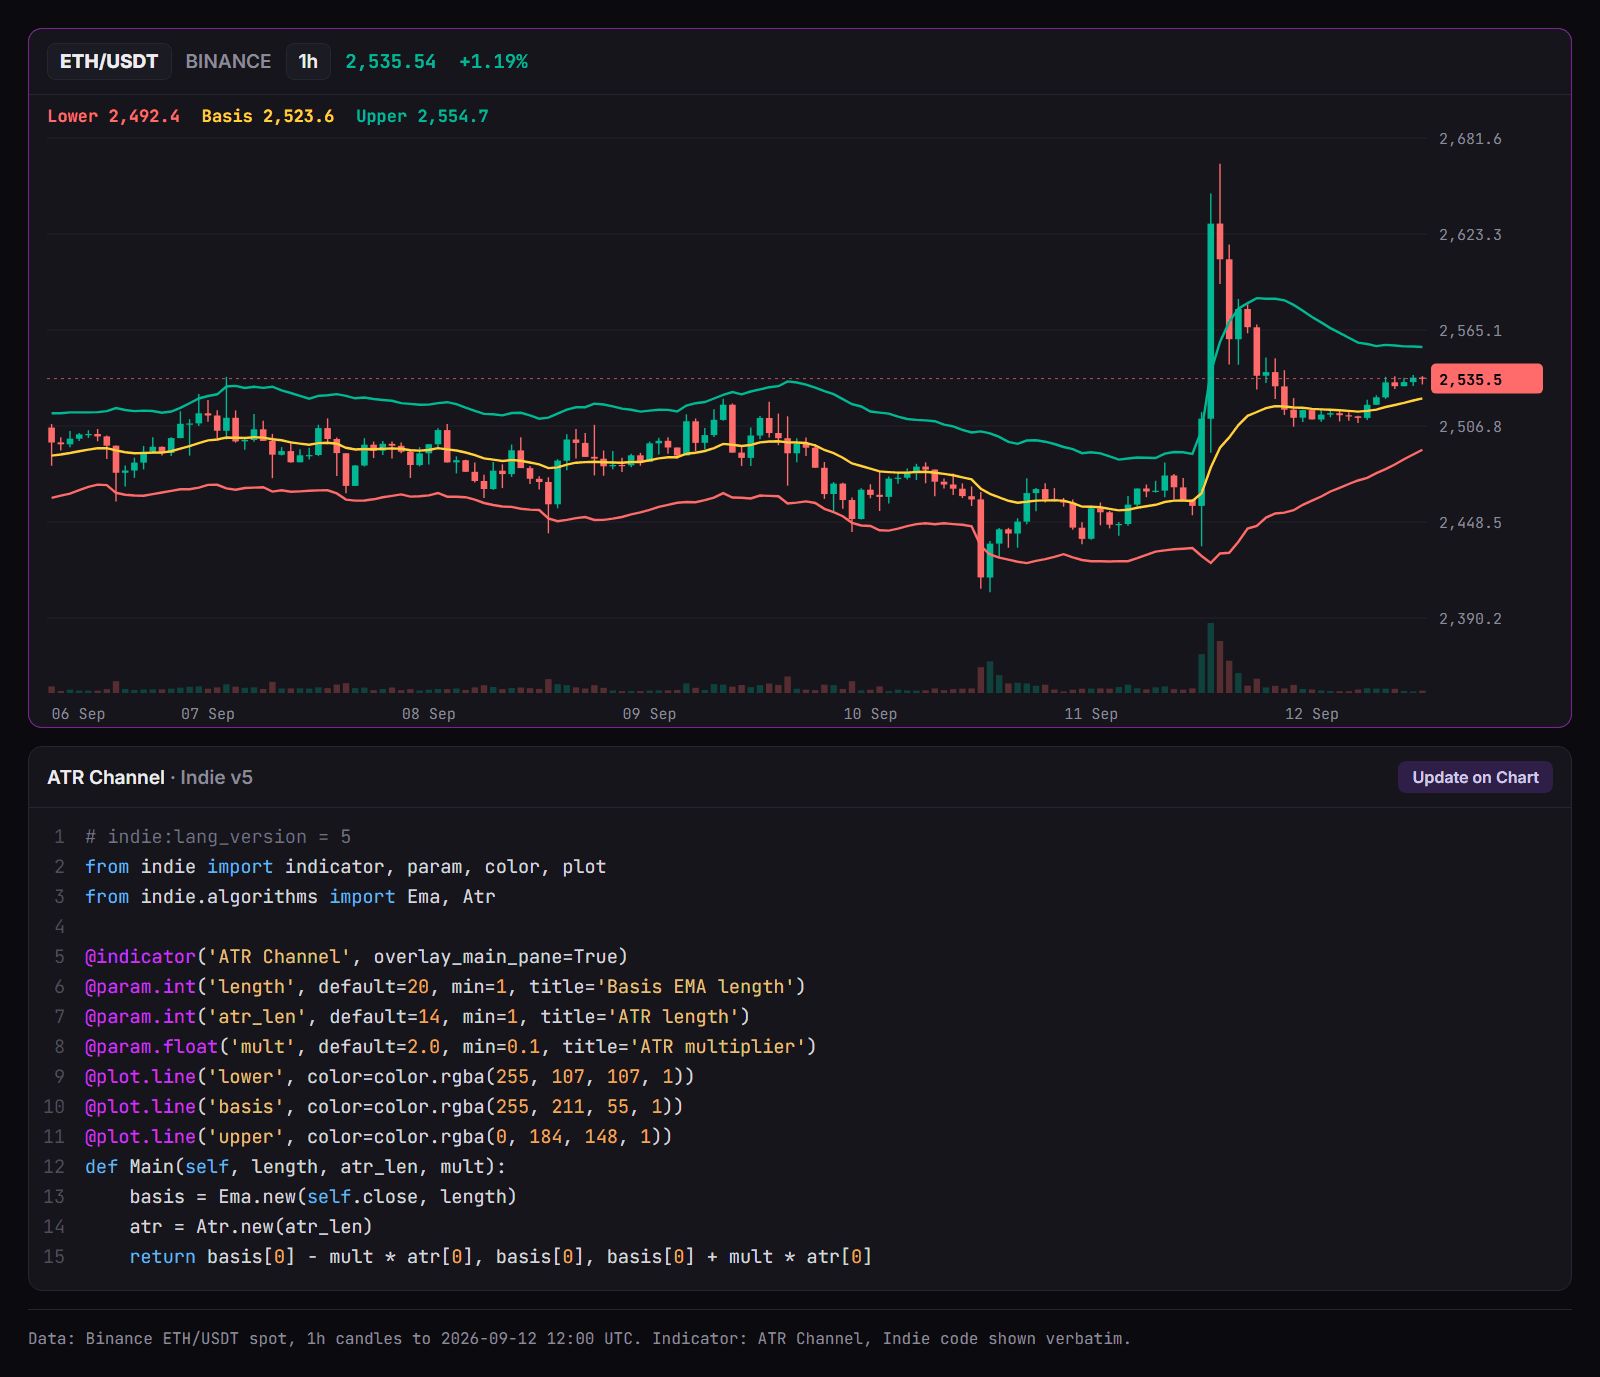
Regime-detection scripts that operate on two or more timeframes simultaneously address the bar-close dependency directly. By monitoring a lower resolution for volatility intensity while consulting a higher resolution for momentum context, the script can evaluate whether an ATR expansion signals a cascade or a broader directional shift. The approach does not remove exchange-feed latency, but it shortens the wait from one higher-timeframe bar to one lower-timeframe bar.
Platforms that support open scripting are stepping in to fill this gap. The community-maintained guide to Indie, a Python-style indicator language, is a good starting point for traders who want to explore the decorator-based syntax and readymade indicator templates. Using the @sec_context decorator, a script can cross-check a short-term ATR expansion against a higher timeframe ADX to decide whether a sell-off is spreading or exhausting itself.
The logic behind a regime detection script
A liquidation regime detector typically follows a pattern that addresses three specific failure modes observed during cascade events: bar-close dependency, NaN propagation from missing ticks, and cross-exchange asynchrony.
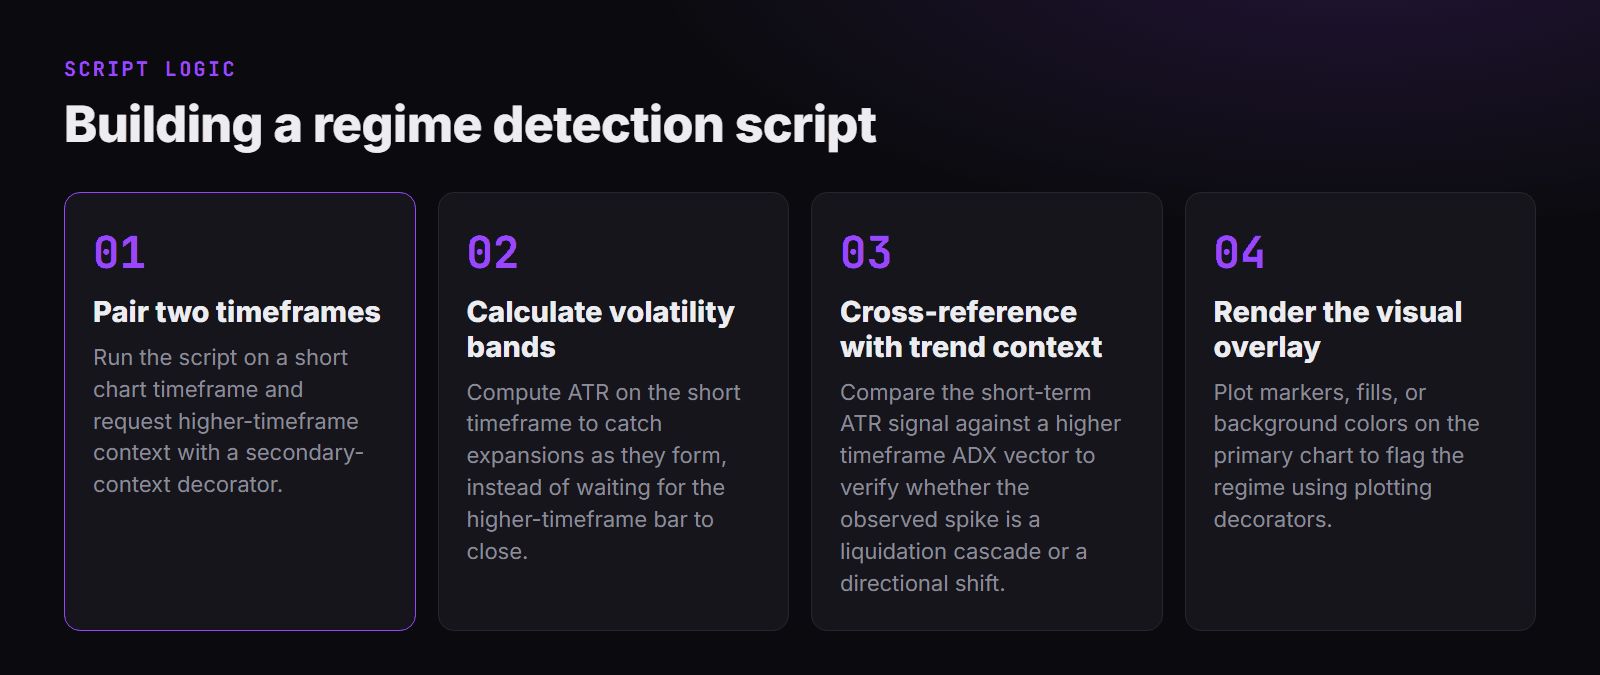
- Cross-reference volatility against momentum: Combine ATR expansion on a lower timeframe with ADX trend strength on a higher timeframe to confirm the nature of the move and filter out false positives.
- Clean missing data during fast moves: Account for NaN values explicitly to prevent phantom signals from propagating through the calculation chain, especially when venue feeds differ in update frequency.
- Render the result as a visual overlay: Use markers or background fills to flag the regime directly on the primary chart so the trader sees the context without switching panels.
- Handle exchange-feed asynchrony: Recognize that liquidation data from different venues arrives at different timestamps, which requires a buffered or weighted input strategy rather than a single tick trigger.
Derivative growth and margin policy amplify the risk
The September 11 cascade did not occur in isolation. The CFTC’s mid-September update imposed a 20% capital charge on proprietary bitcoin and ether positions and permitted DCOs to accept crypto assets as initial margin, altering the balance-sheet math for dealers. At the same time, the continued rollout of cash-settled crypto futures across traditional global exchanges is adding unprecedented institutional depth to the derivatives curve. Volatility stayed elevated afterwards: on September 14, Bit.com’s volatility panel showed readings of about 34.6 for BTC and 50.7 for ETH.
None of this predicts the next cascade. It does mean leverage now sits across more venues and margin regimes, so liquidation flows can arrive from more directions at once. A fixed indicator library designed for steady-state conditions is poorly equipped for an environment where volatility velocity routinely outpaces candle resolution and cross-exchange asynchrony compounds the lag.
The September 11 cascade showed how quickly forced liquidations can outrun a chart’s candle resolution. Standard indicators remain useful for baseline trend analysis, but traders who rely solely on single-timeframe oscillators face a widening gap between chart resolution and market velocity. Tailored scripts that manage multi-timeframe context and explicit data validation are becoming a practical necessity for crypto analysis rather than an edge-case tool.
This article is for informational purposes only and does not constitute investment advice.
The material on GNcrypto is intended solely for informational use and must not be regarded as financial advice. We make every effort to keep the content accurate and current, but we cannot warrant its precision, completeness, or reliability. GNcrypto does not take responsibility for any mistakes, omissions, or financial losses resulting from reliance on this information. Any actions you take based on this content are done at your own risk. Always conduct independent research and seek guidance from a qualified specialist. For further details, please review our Terms, Privacy Policy and Disclaimers.
Articles by this author