Why is Ethereum going down?

Ethereum extended this week’s decline, with sellers leaning on a fragile post-selloff tape. Here’s a trader’s breakdown of the catalysts and levels that mattered in the past 24 hours as of September 25, 2025.
Key points
- Post-selloff deleveraging weighed on risk appetite and fueled an Ethereum price drop.
- Spot ETH ETF flows and thin liquidity exaggerated downside wicks.
- Ultra-low gas and muted on-chain activity signaled weak demand on rallies.
Ethereum fell in the last 24 hours, slipping below $4,100 and then tagging the $3,990 area. As of early morning UTC, market data showed ETH down about 4.67% on the day, underscoring a fragile tape after the week’s broader crypto selloff.
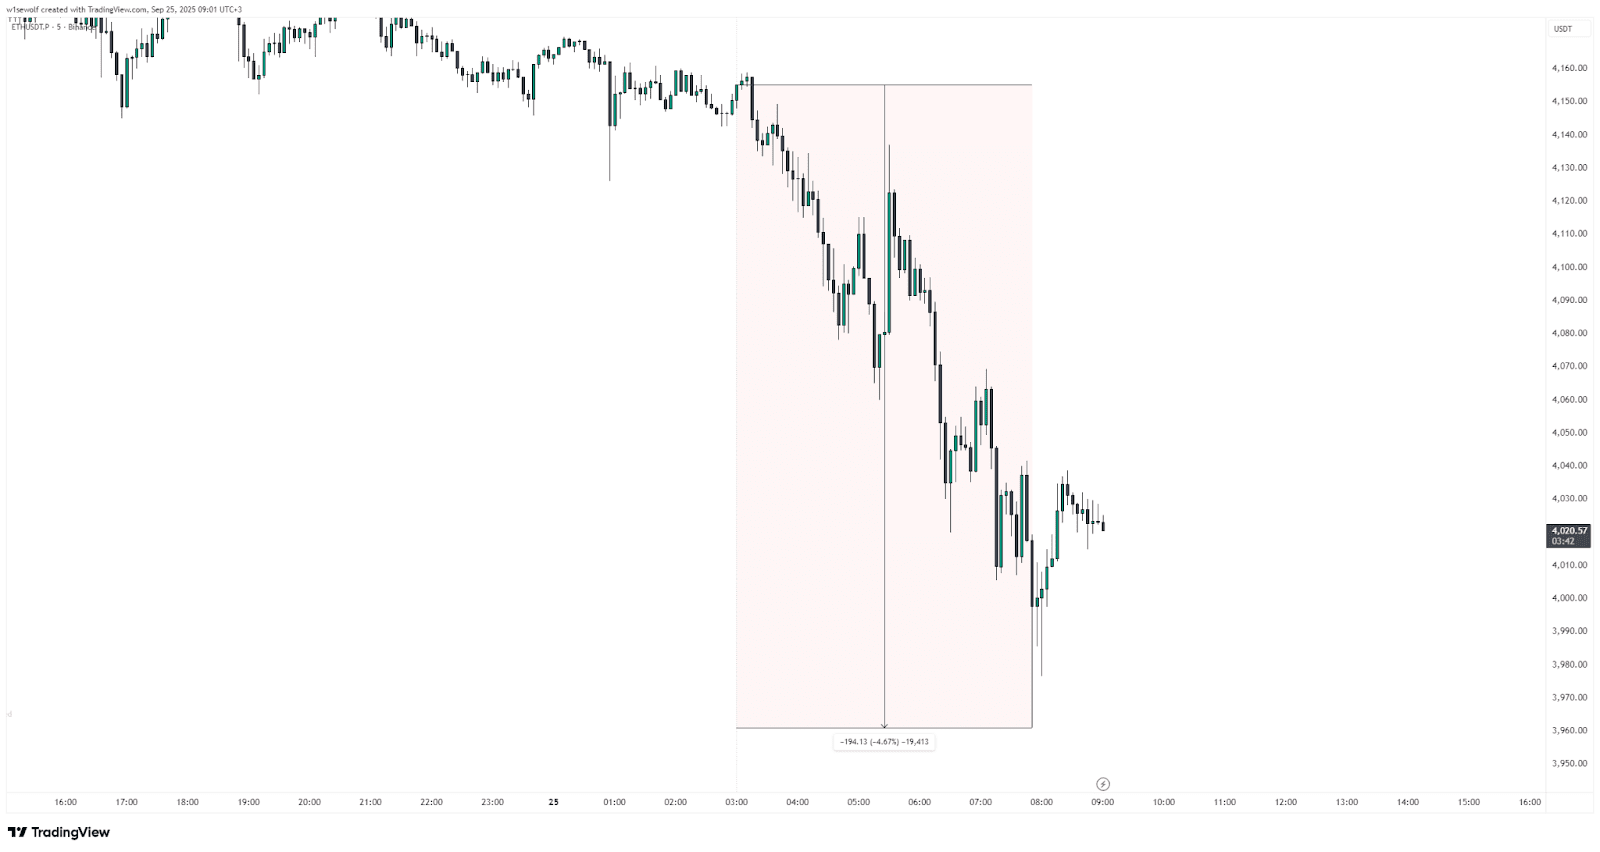
ETH dropped about 4.67% over 24h. Source: tradingview.com
This article explains why is ETH going down in trader terms: lingering deleveraging after Monday’s flush, lukewarm spot-ETF flow signals that thin out bids, and ultra-low gas pointing to soft on-chain demand.
Post-selloff deleveraging keeps pressure on
The market is still digesting one of 2025’s sharpest crypto shake-outs. Broad-based weakness across majors persisted mid-week, with ETH slightly underperforming at times as traders reduced risk and perp positions after a large leverage reset. That backdrop left order books thinner and bounces easier to fade, explaining why did Ethereum drop.
Macro didn’t help intraday sentiment: traders remained cautious into key U.S. data while the dollar tone stayed mixed, keeping risk assets choppy and discouraging aggressive dip-buying on ETH. In an environment where liquidity is patchy, even modest waves of market sells continue to travel further than usual.
ETF net flows and spot liquidity skew order book
Since launch, spot ETH ETFs have become a meaningful share of spot turnover, but day-to-day flows remain uneven. On September 24, the products registered net outflows of $79.3 million, according to SoSoValue data – a clear drag on bids.
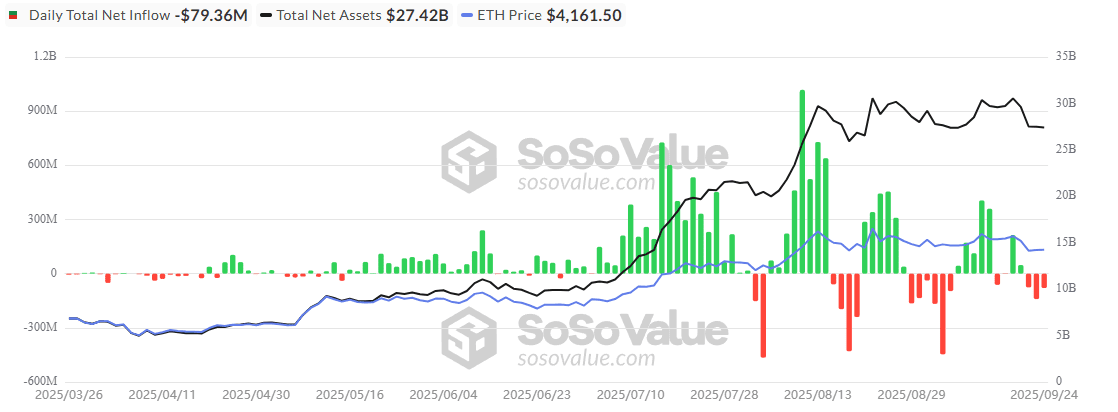
On Sept. 24, spot Ethereum ETFs showed −$79.3 million flows. Source: sosovalue.com
When creations slow or redemptions appear alongside thin books, downside moves accelerate, which helps answer why is Ethereum falling without invoking new fundamental shocks.
In this tape, even neutral-to-soft ETF prints can matter: they reduce the marginal bid just as futures funding normalizes after a purge. With fewer passive buyers absorbing supply, discretionary sellers have an outsized footprint and intraday lows are easier to probe.
Ultra-low gas and on-chain activity signal weak demand
On-chain, gas hovered near cycle lows in recent sessions, a proxy for subdued user activity. When base fees and transaction pressure are this light, it often reflects a lull in DEX, NFT, and DeFi flows. This kind of backdrop starves spot demand and leaves ETH vulnerable, which is exactly why Ethereum is going down today.
Traders watch this as a sentiment tell: when activity dries up, rallies rely on synthetics and are easier to fade. Combined with the post-flush caution and temperate ETF impulses, ultra-low gas added one more headwind to today’s price action.