Weekly Analysis of BTC, ETH, and Altcoin Markets, June 10, 2024

An overview of BTC, ETH, DOGE, ETC, APT, ATOM, charts, and the current cryptocurrency market dynamics.
Bitcoin (BTC)
Despite a recent dip following the release of U.S. non-farm payroll data on June 7, the overall market outlook for Bitcoin remains largely unchanged.
Bitcoin continues to oscillate between a support range of $65,200–$66,800 and a resistance zone of $70,900–$72,700. This resistance was tested last week, but buyers were unable to push the price to a new all-time high, resulting in a local correction.
Currently, Bitcoin is near the local support zone of $68,500–$69,200, which is preventing further declines. If sellers break this range, BTC could drop to a support level of $67,750. However, even a decline to the $62,500–$63,500 zone would not shift the upward trend to a downward one, so the bullish outlook remains intact.
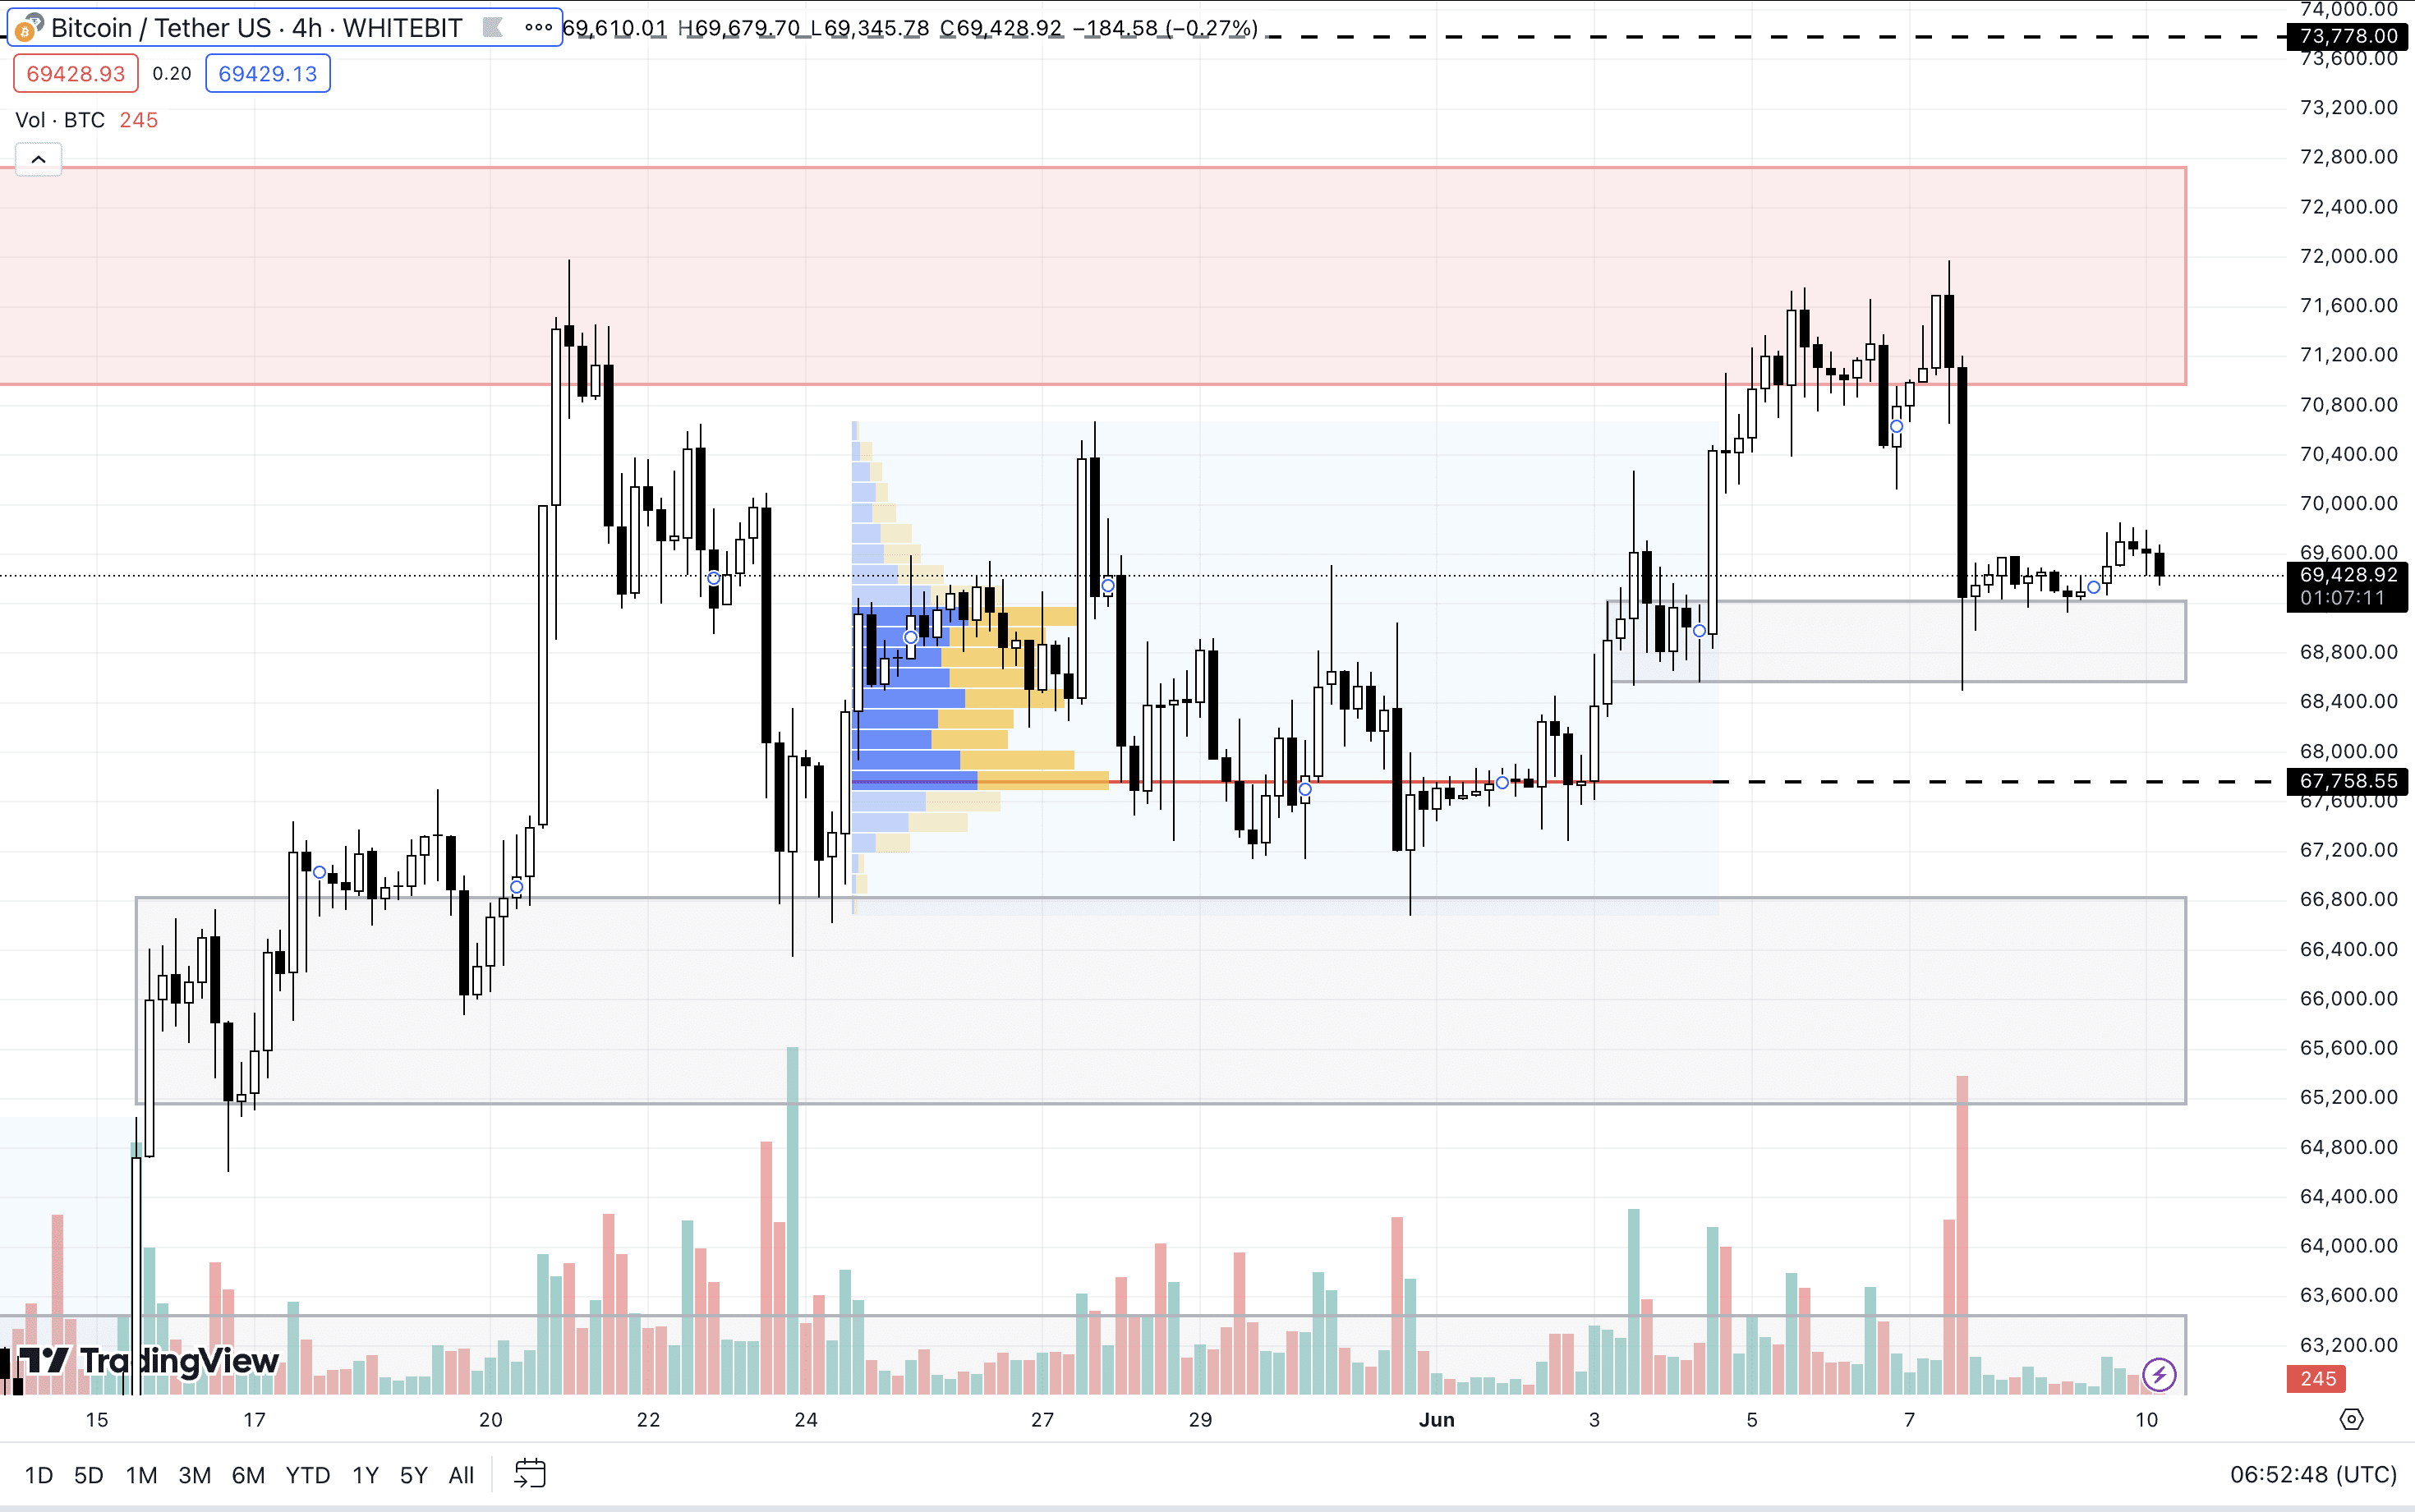
BTC H4 Chart
Ethereum (ETH)
As Bitcoin fell, Ethereum dipped below the $3,800 mark and is now trading within a local sideways range between a support zone of $3,600–$3,650 and resistance at $3,760–$3,810.
Should BTC regain upward momentum, ETH could break this range, potentially stabilizing above the $3,880 mark and opening a path to the $4,000–$4,100 zone.
In case of a further correction, Ethereum might reach new local lows, starting at $3,528.

ETH H2 Chart
Dogecoin (DOGE)
While the global trend for Dogecoin remains bullish, it is currently confined within a local range between the support zone of $0.136–$0.142 and the resistance zone of $0.15–$0.157.
The coin has the potential to extend its gains and reach the resistance zone of $0.170–$0.181, which could lead to a new yearly high. This would require a positive push from Bitcoin reaching a new all-time high (ATH).
If a deeper correction ensues, Dogecoin could fall below $0.130.
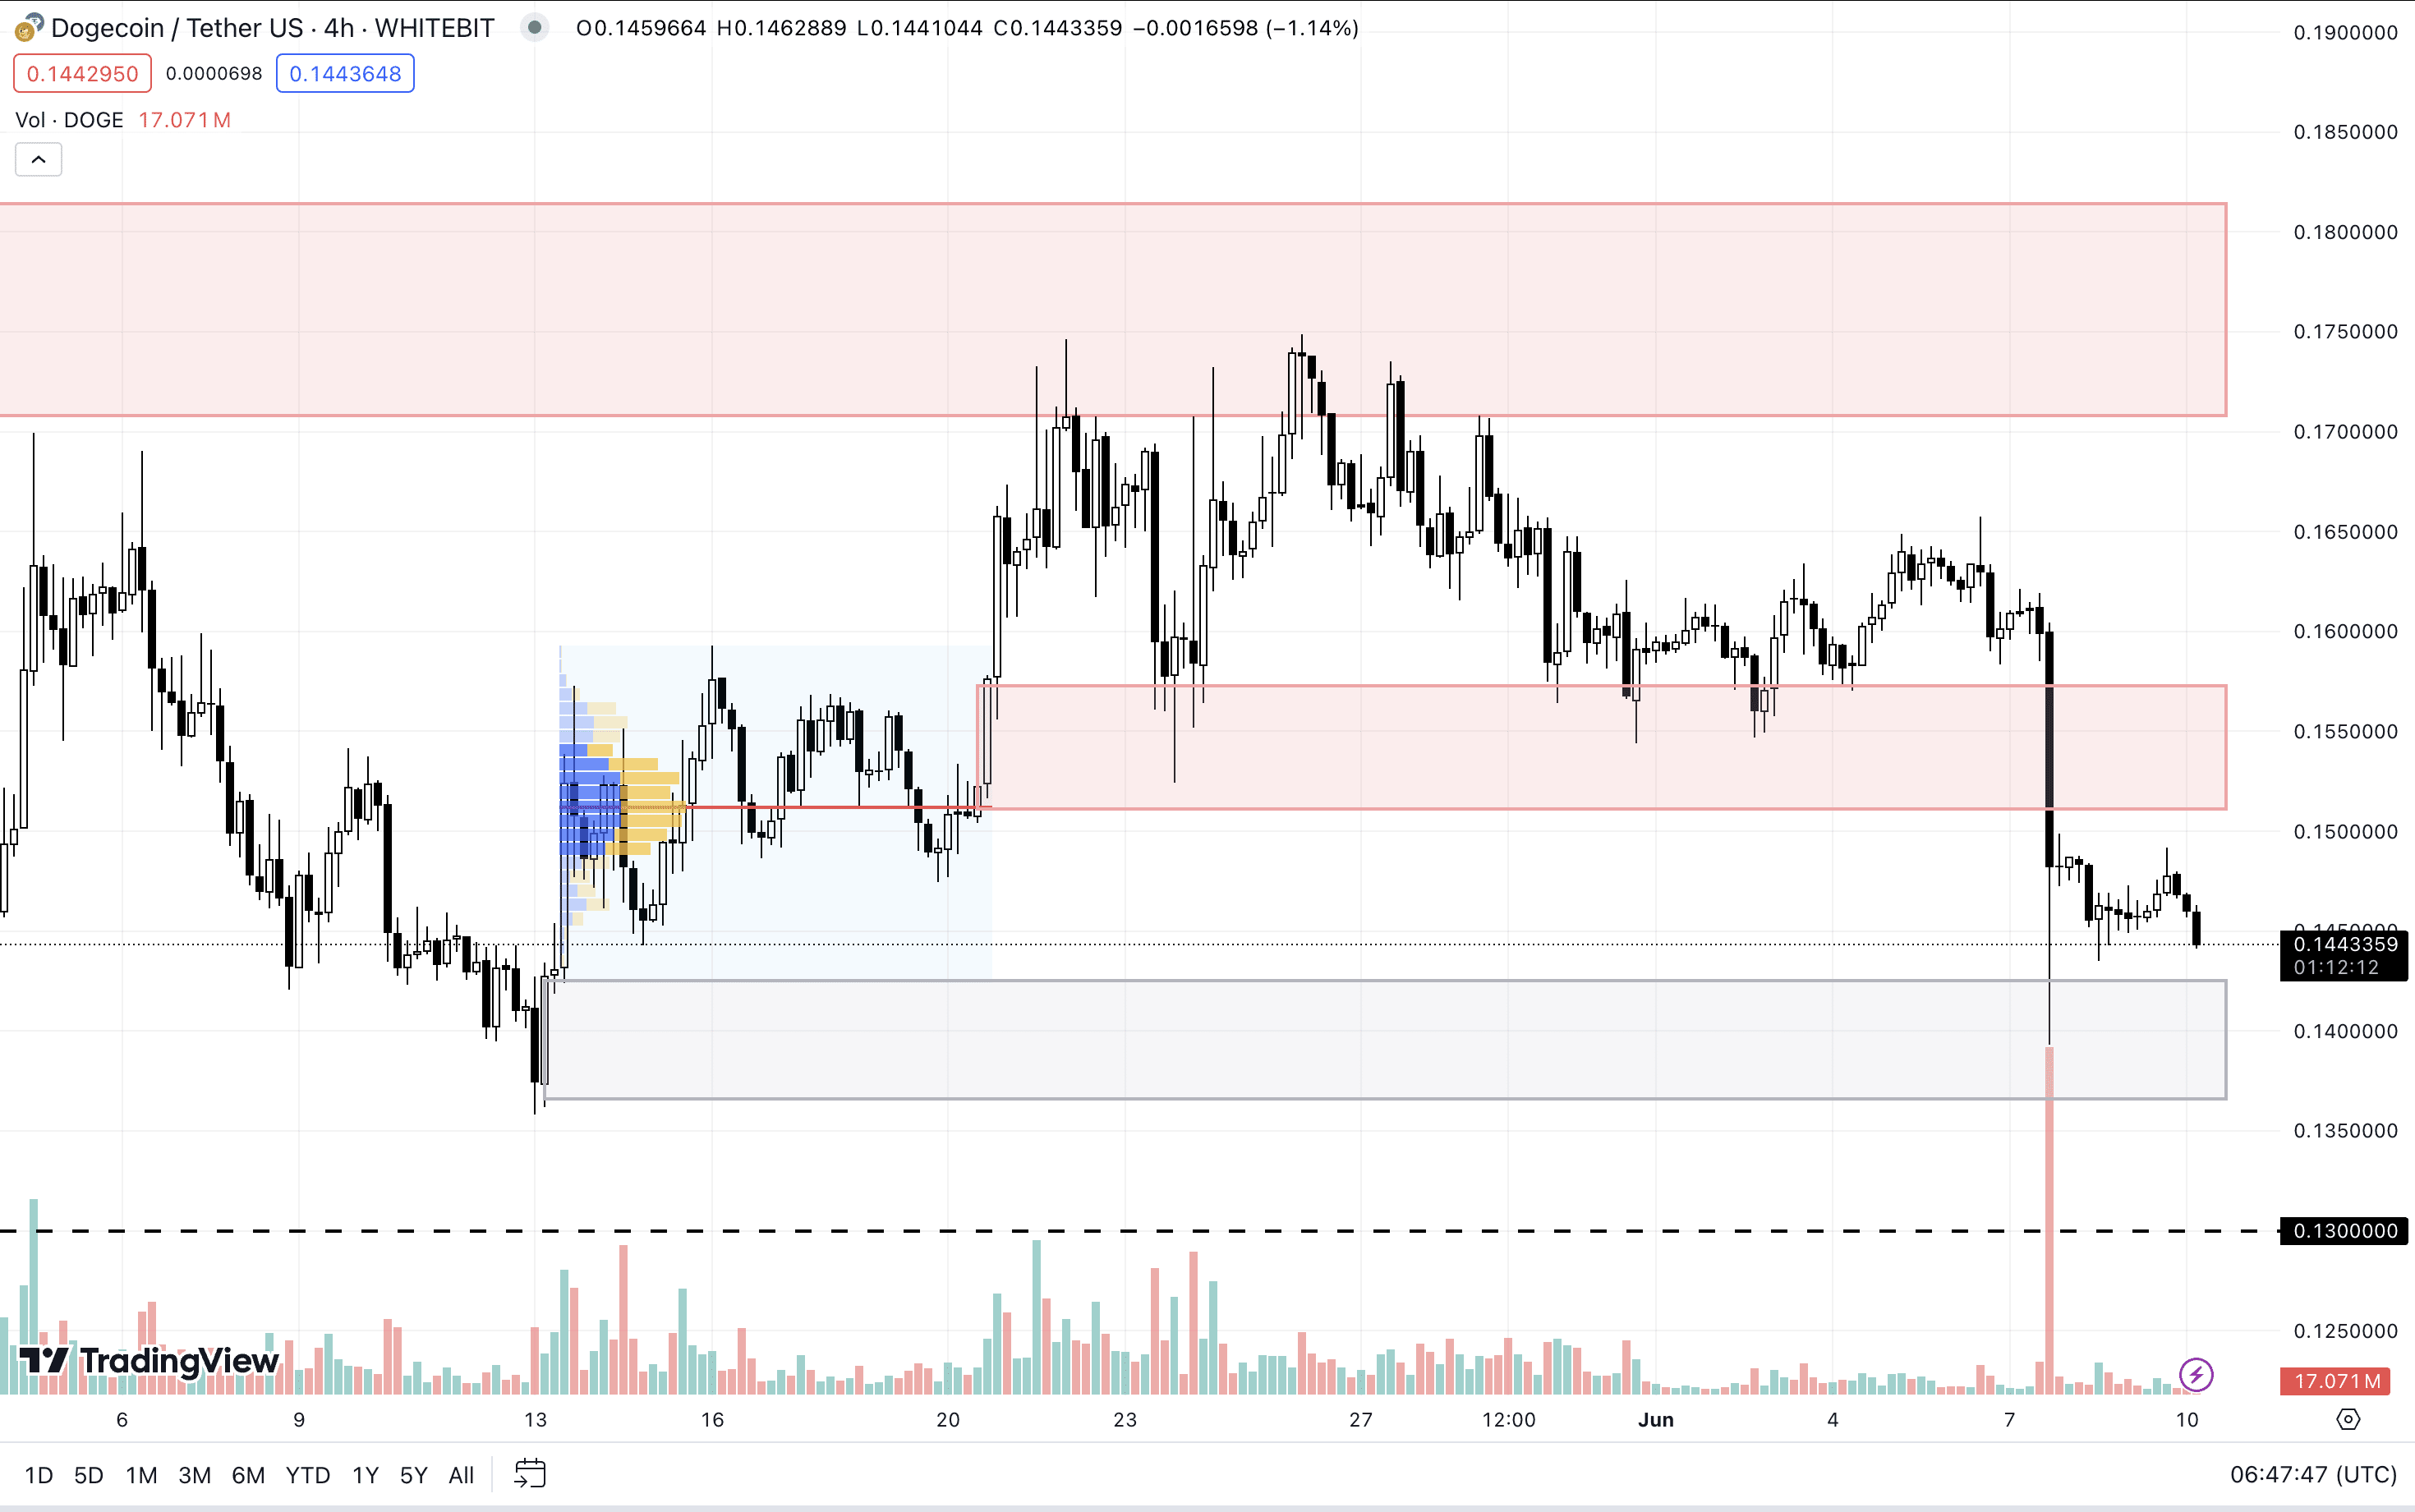
DOGE H4 Chart
Ethereum Classic (ETC)
After reaching a local high of $39.6 on March 9, 2024, Ethereum Classic has undergone a 34% correction, bringing it down to the support zone of $25.2–$26.4. Despite this, it maintains an overall upward trend. This asset is particularly sensitive to Bitcoin's fluctuations.
A definitive shift to a bearish trend could be considered if significant negative news regarding BTC occurs and ETC settles below $23.
As long as this has not happened, the asset could still resume its ascent, provided there is sufficient buying interest. The next targets for ETC might be the $28.7–$30 and $31.68 zones.
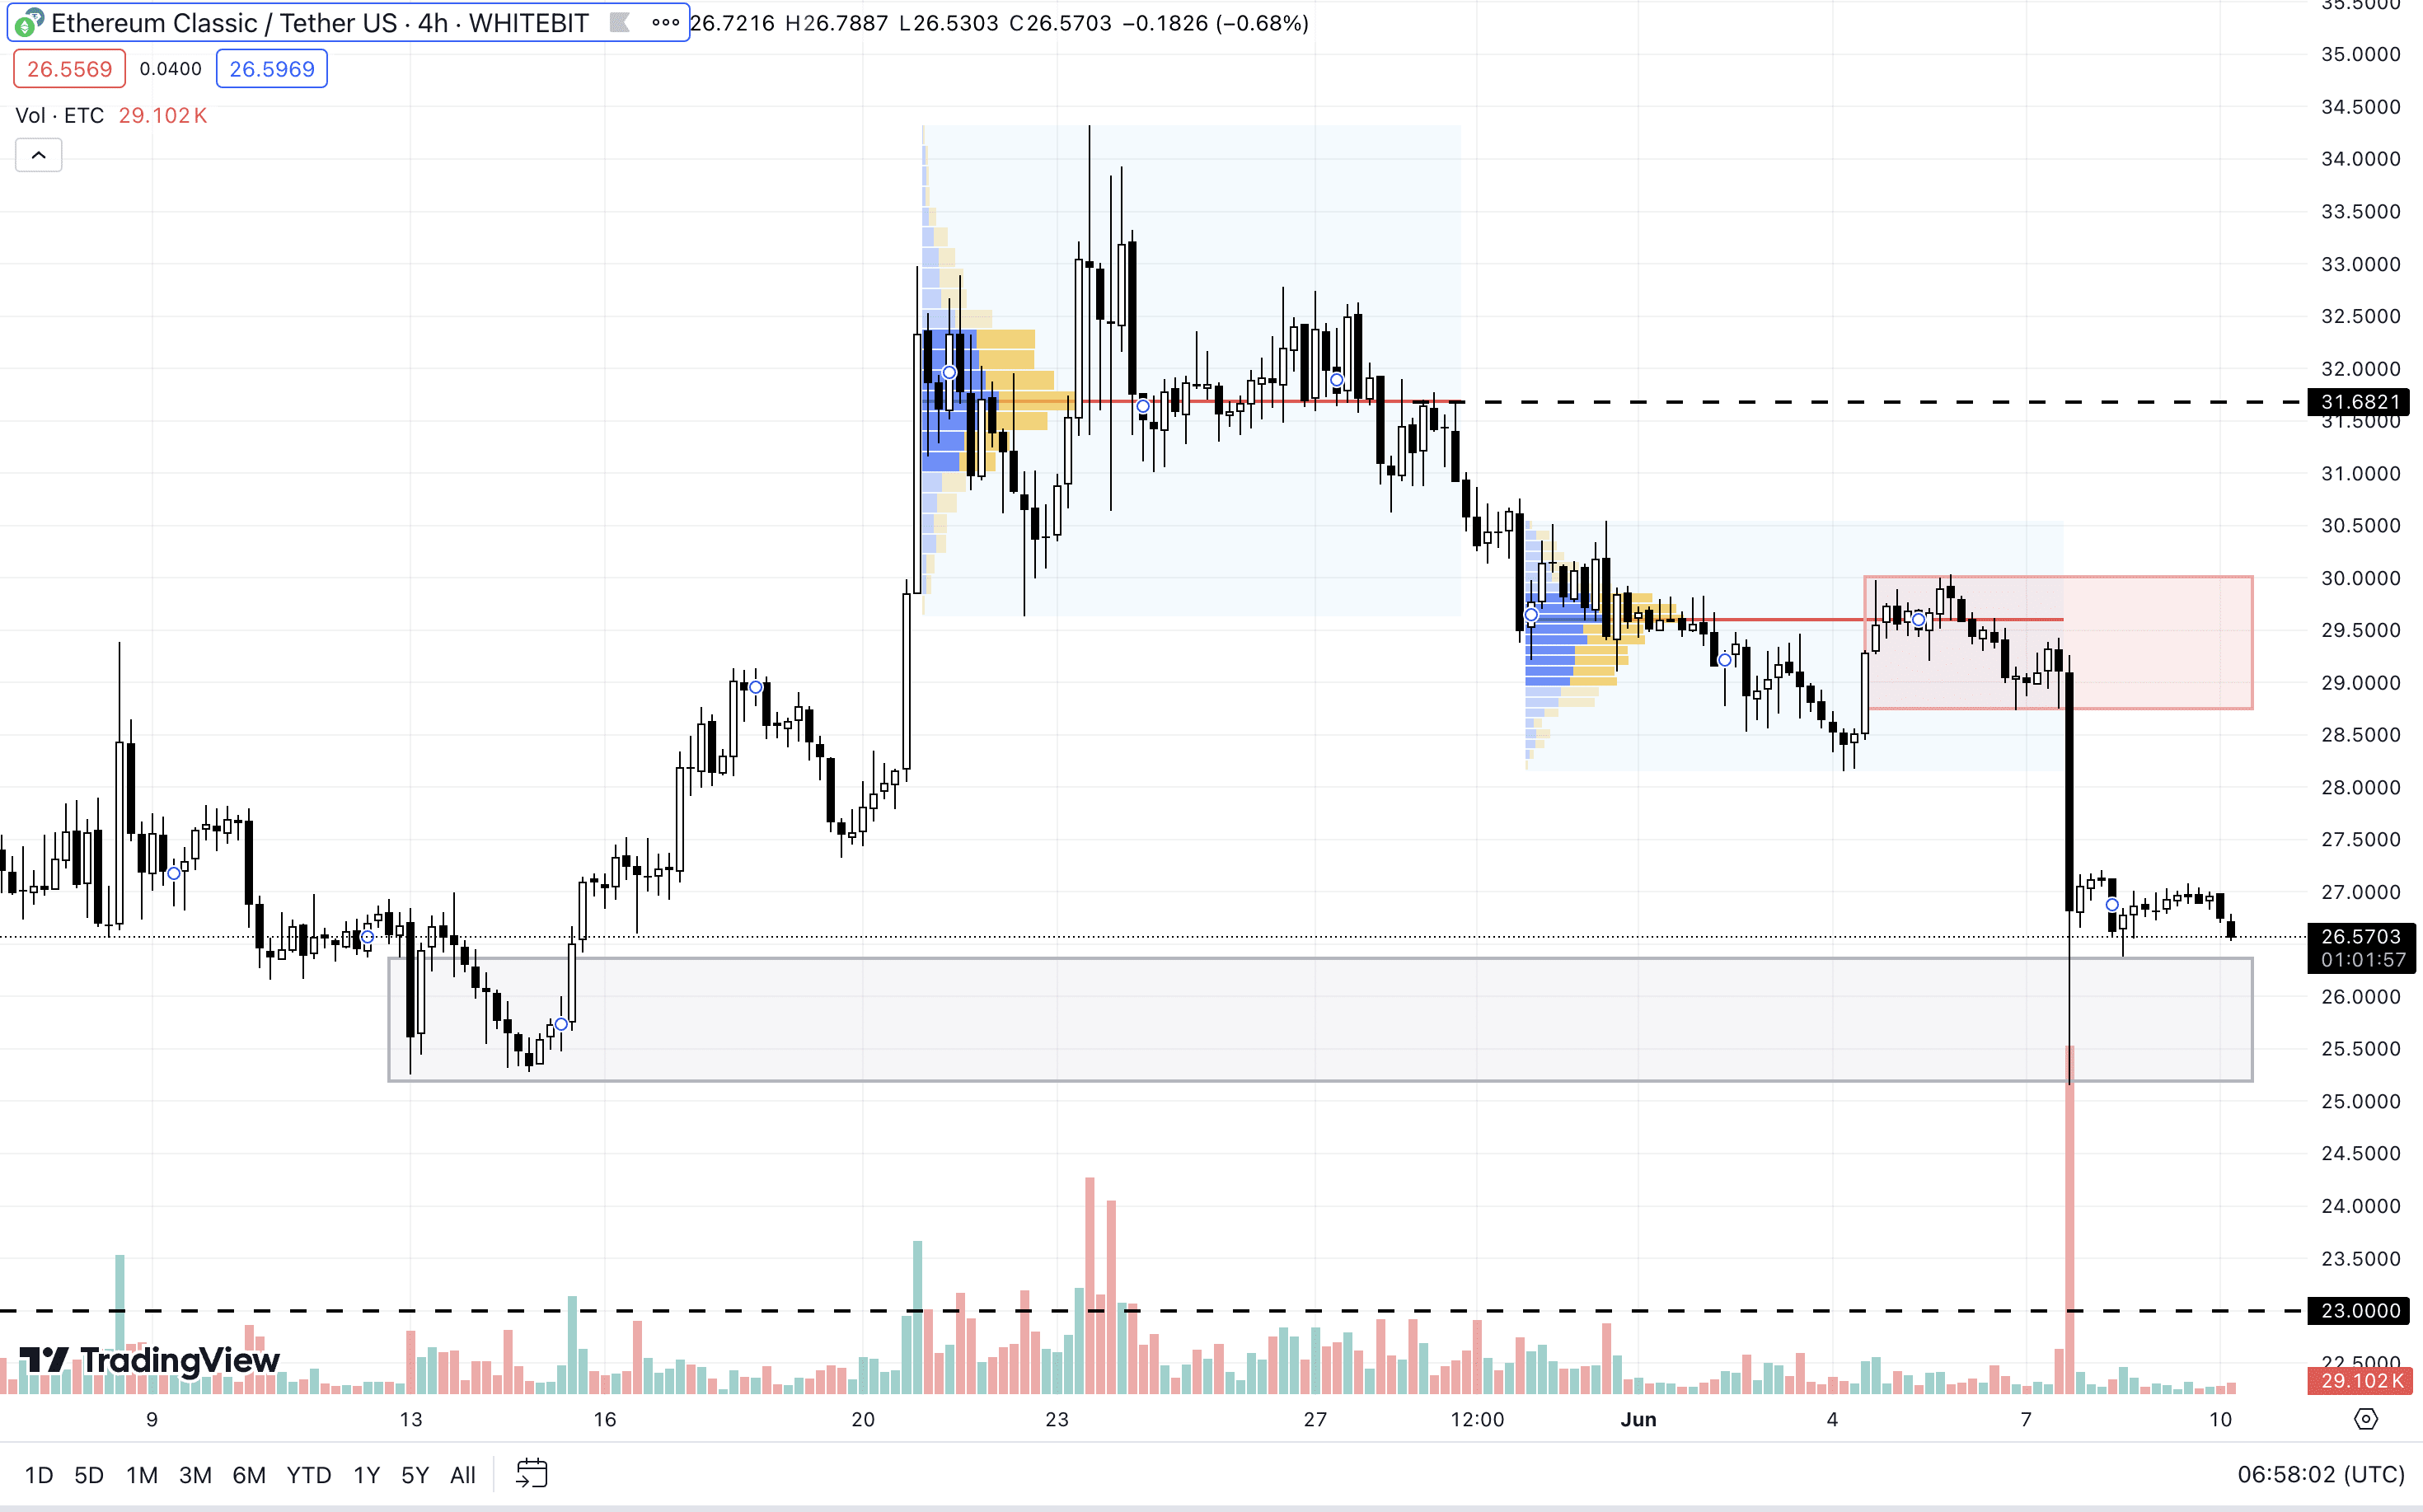
ETC H4 Chart
Aptos (APT)
APT has been trading within a wide sideways range for nearly two months, with support at $7.30–$8.30 and resistance at $10–$10.75. A critical area for buyers will be the local cluster between $8.75–$9.10, formed after a recent drop last Friday.
APT will likely continue to trade sideways, independent of Bitcoin's movements. While a temporary dip to the $7 level is possible, this could represent the last opportunity for buyers to push the trend upward, particularly if the price can solidify above $11.
Conversely, a fall below $7 and staying under this level would negate the bullish scenario.
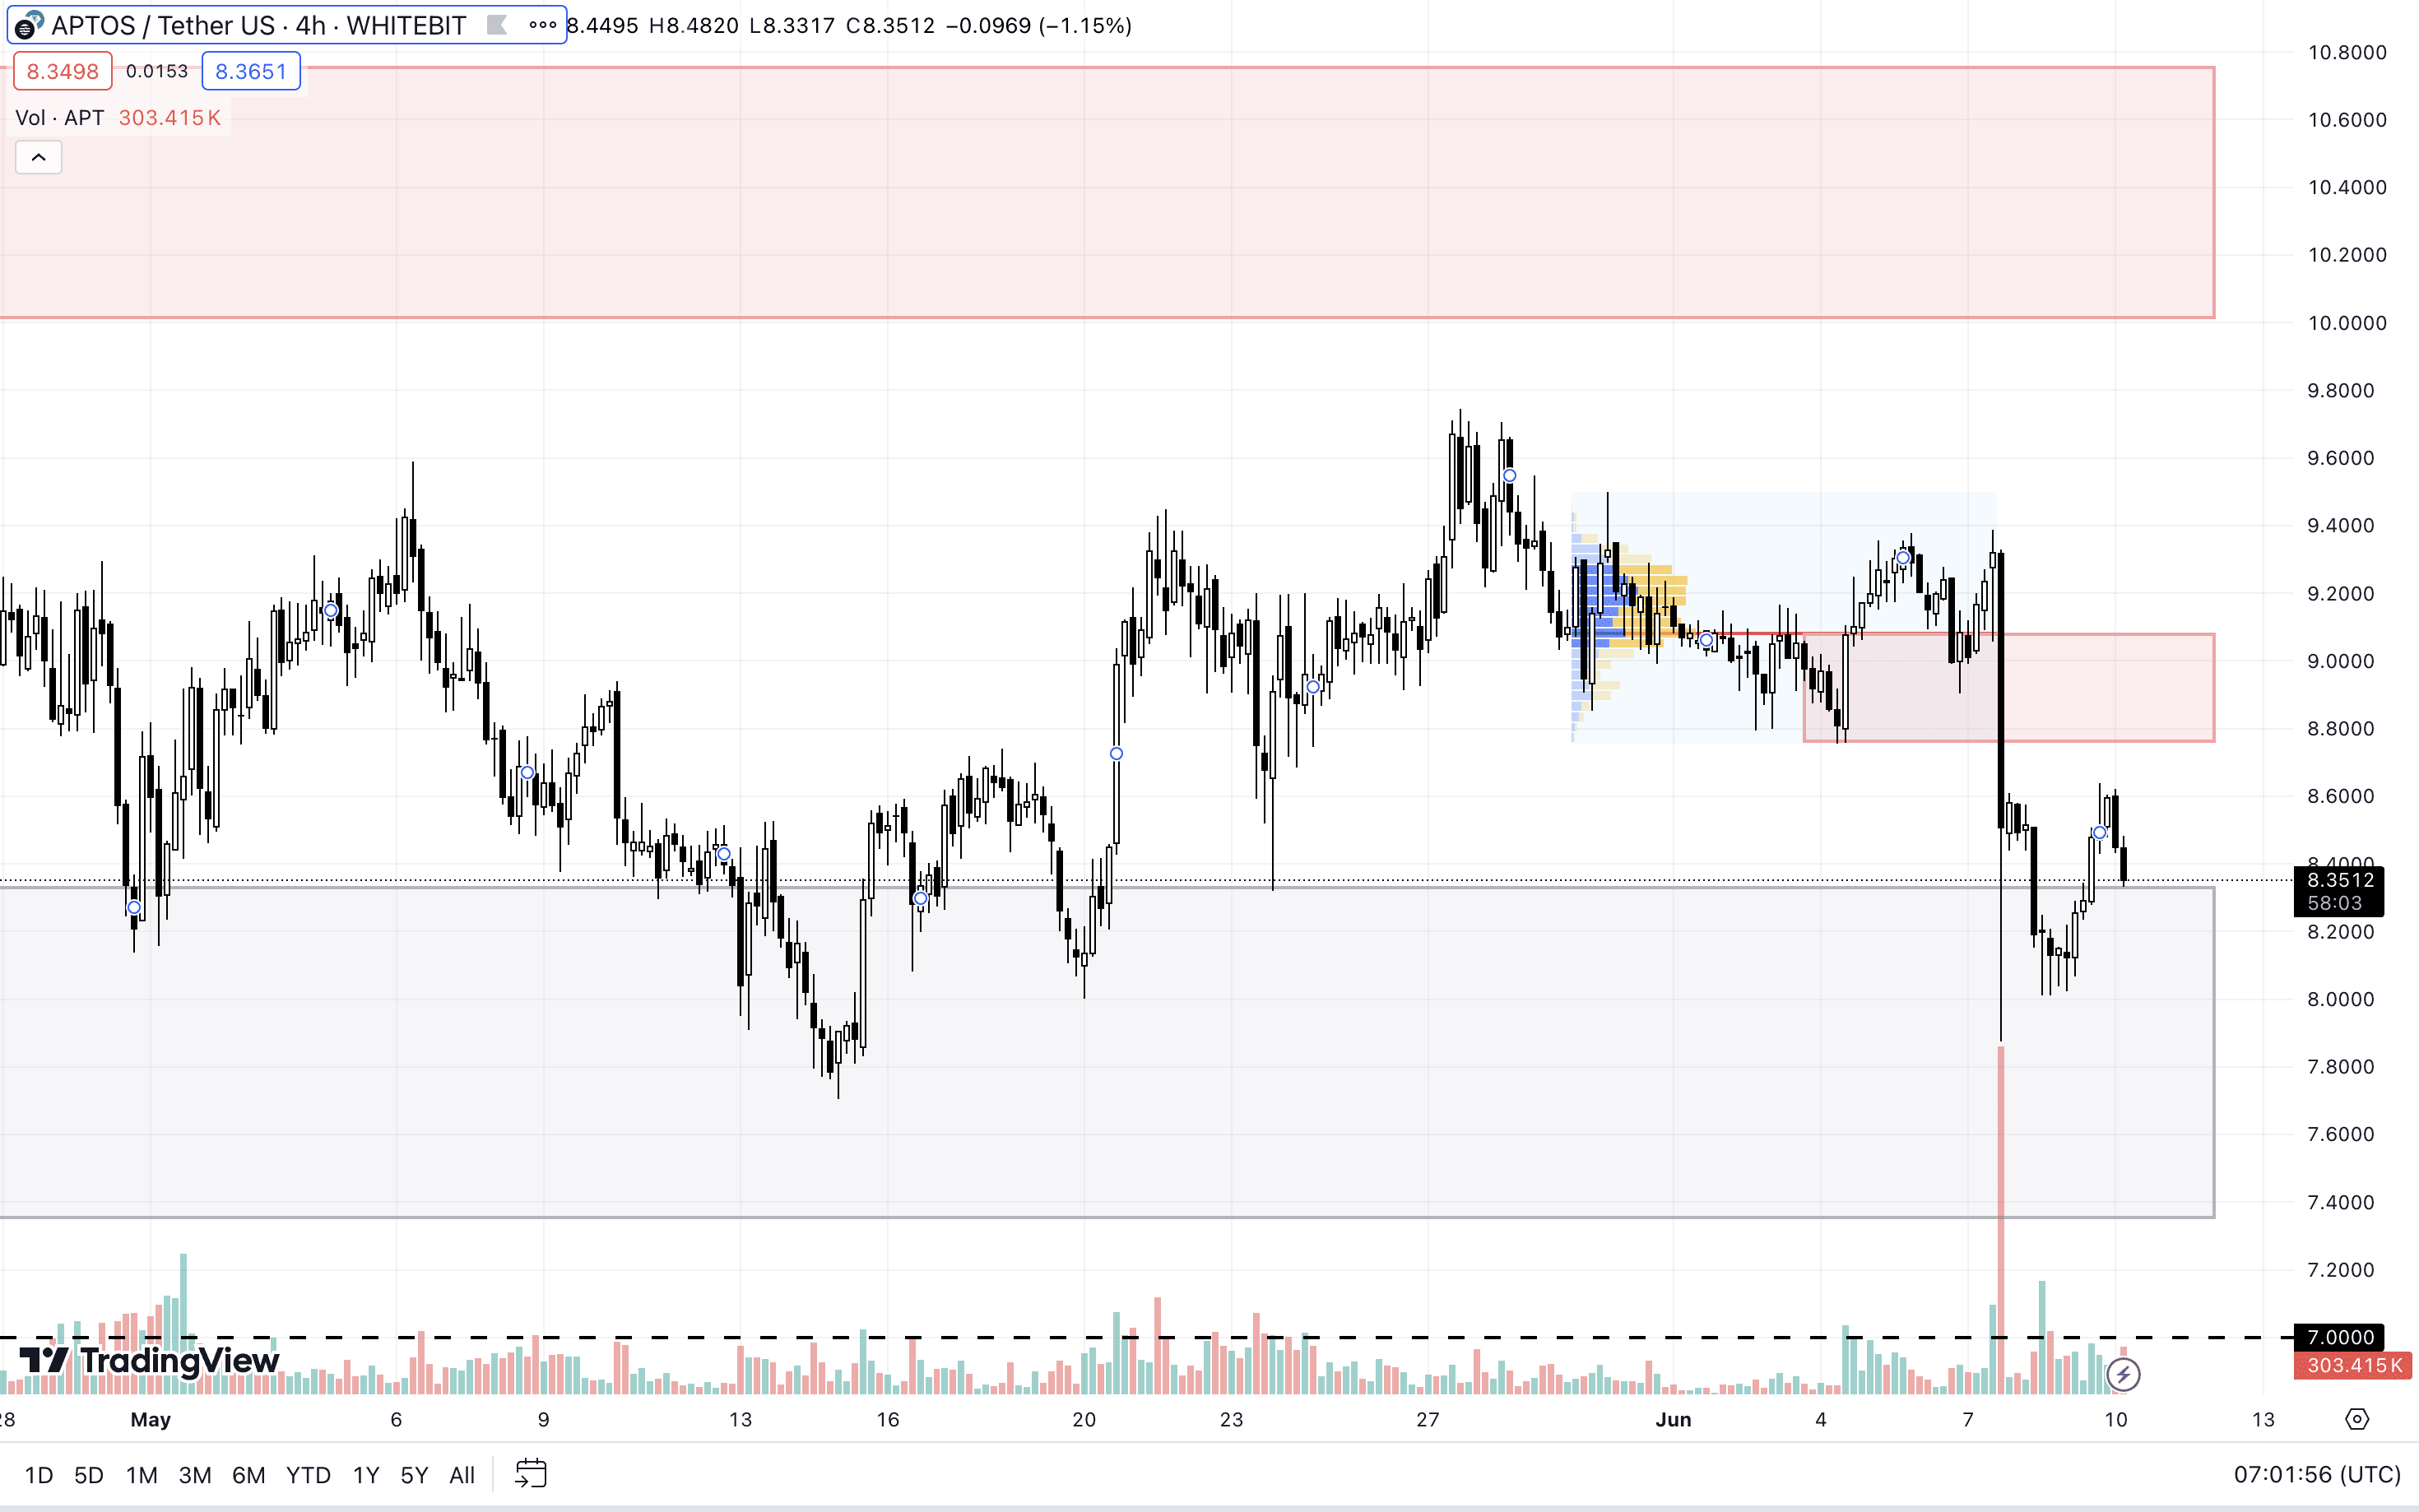
APT H4 Chart
Cosmos Hub (ATOM)
ATOM is currently caught in a trading range between the support zone of $7.54–$8.00 and the resistance area of $8.70–$9.00. Buyers also need to break through a resistance at $8.33.
It’s worth noting that ATOM is experiencing a general downward trend. Beyond the specified support zone, we do not see strong levels of buyer interest, which could result in a significant deepening of the correction.
However, if the market sentiment turns bullish, buyers might manage to drive ATOM's price into the resistance zone of $9.70–$10.36.
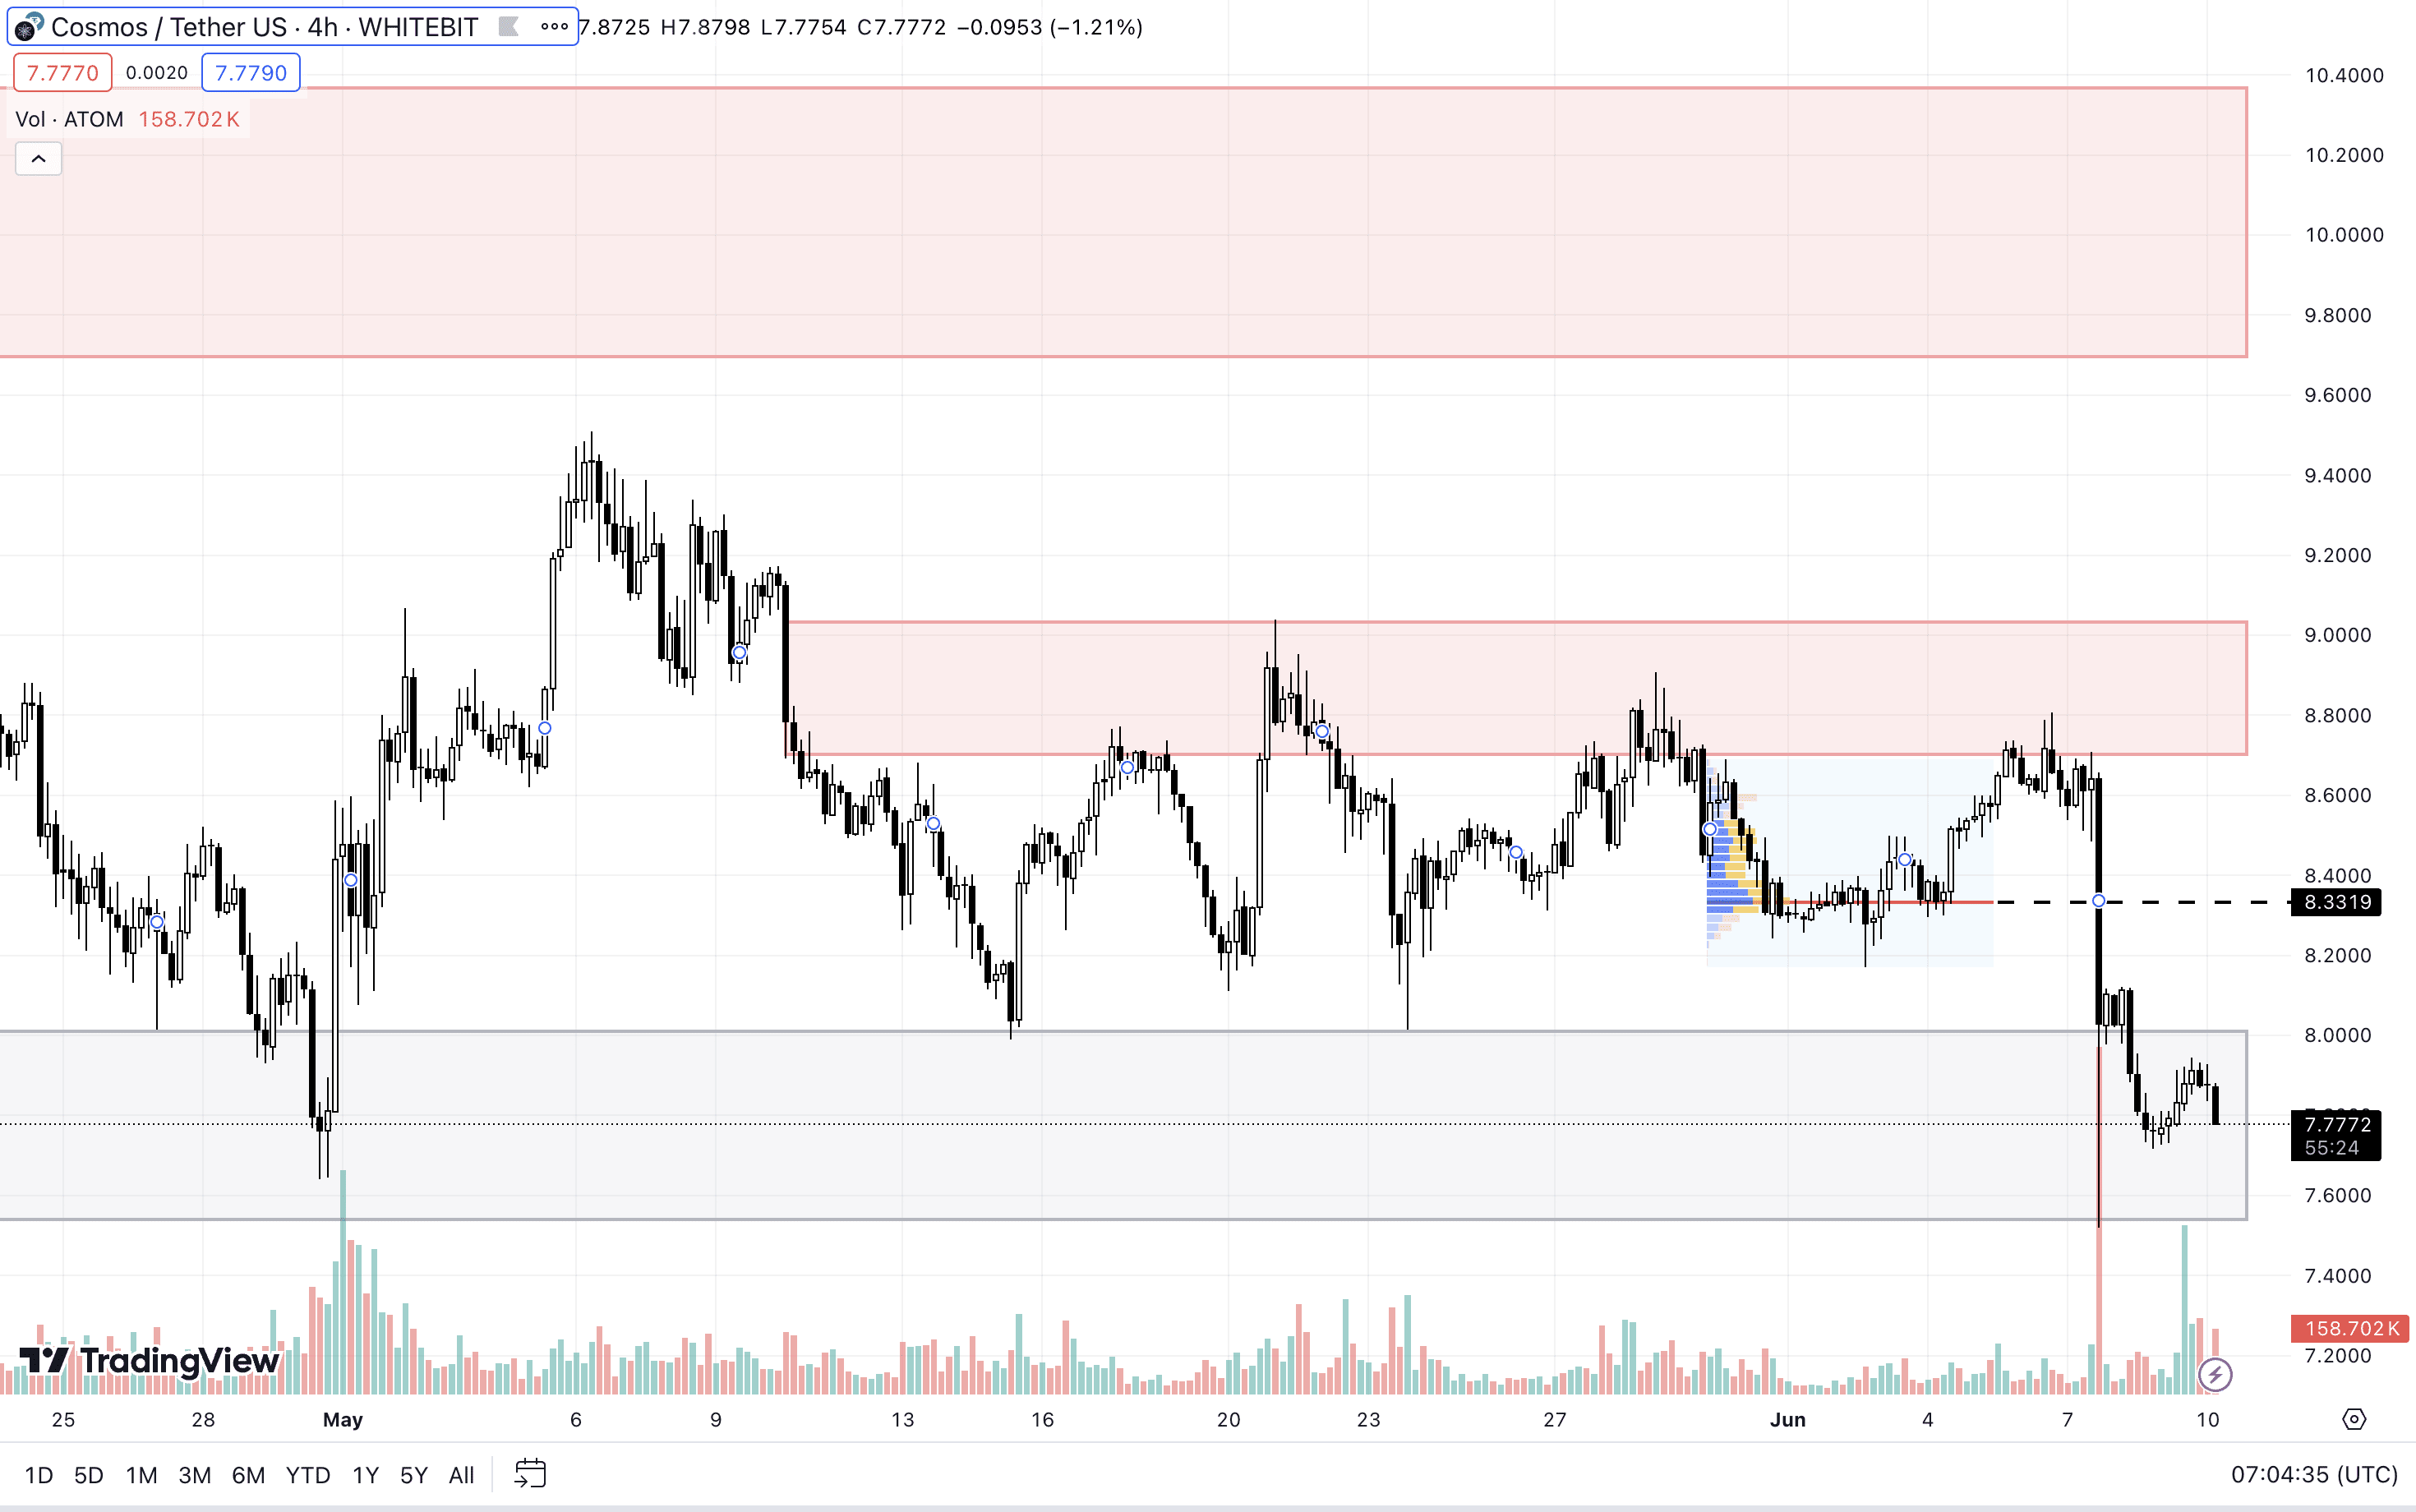
ATOM H4 Chart
BTC Dominance, Altcoin Season Index, and Fear and Greed Index
Bitcoin's dominance rose by 1% to 55.48% following the BTC price fall on June 7, indicating that altcoins suffered even greater losses relative to Bitcoin, which affected their market capitalization disproportionately.
There are currently no indications that this trend will reverse, suggesting Bitcoin continues to be the asset of choice for investors.
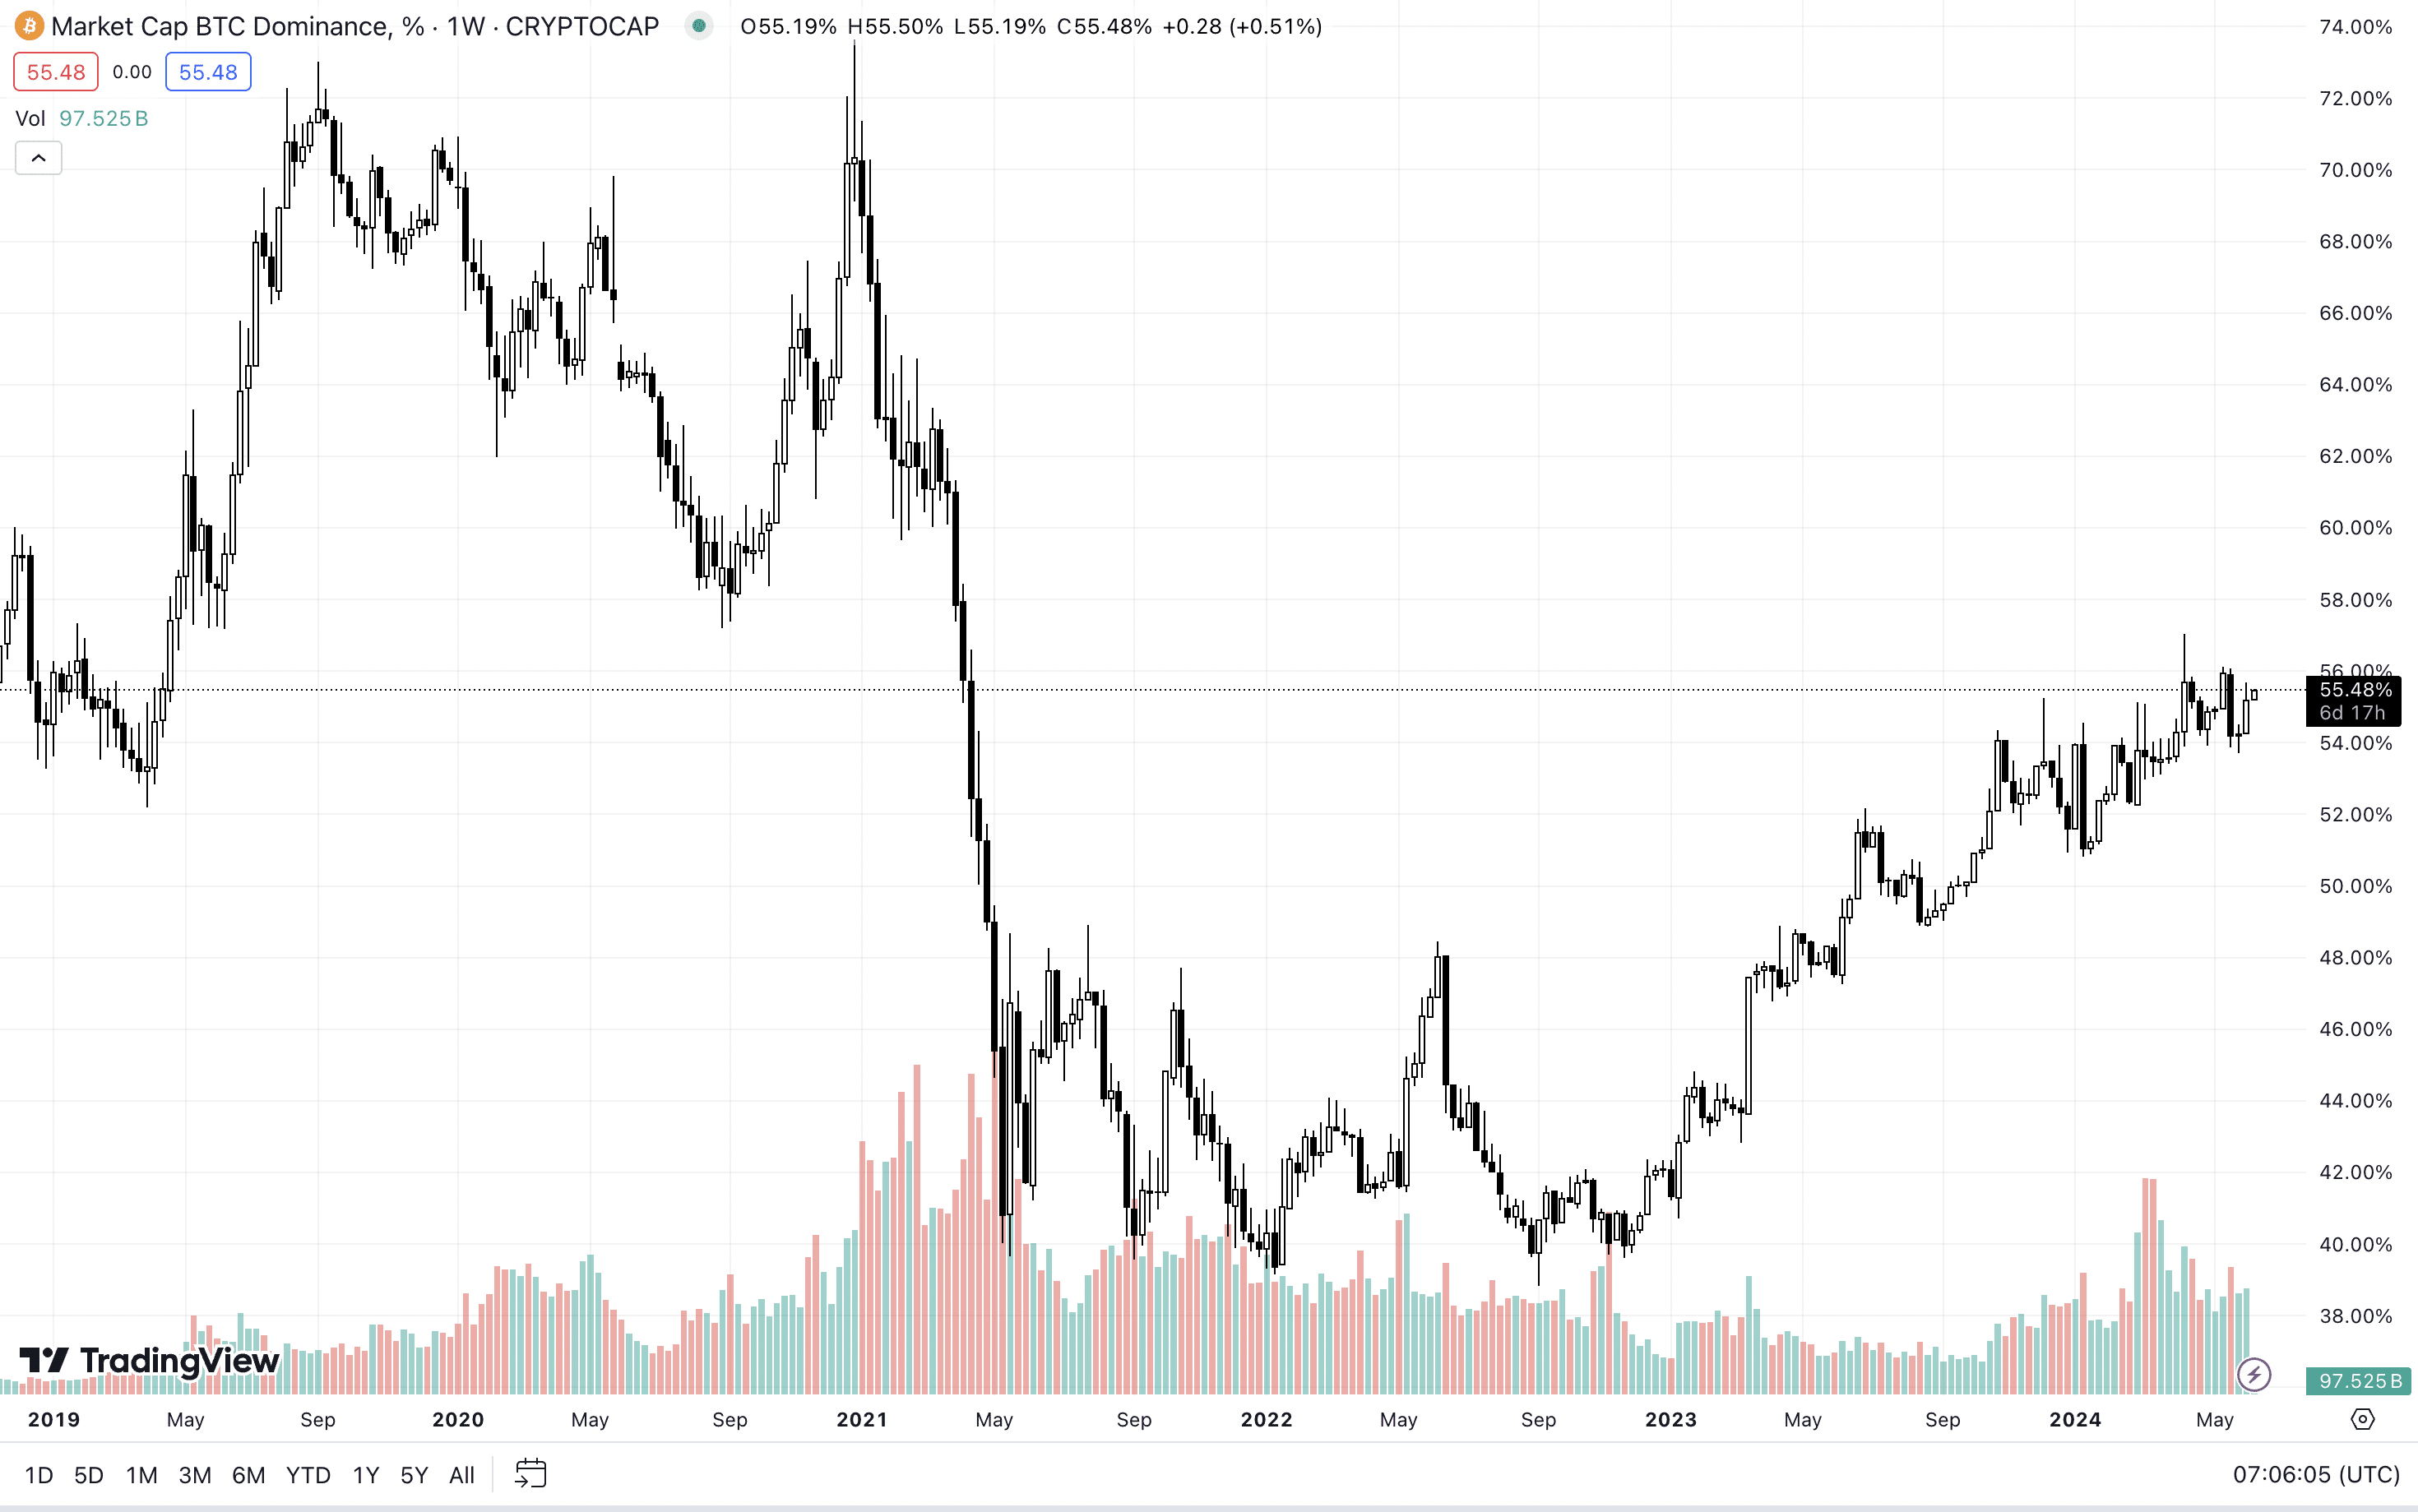
BTC Dominance Index. Source: tradingview.com
The Altcoin Season Index has fallen to 25 points after a decline of 8% last week, signaling a bleak period for the altcoin market. This low score confirms that investor interest in altcoins is minimal, and their attractiveness declines further during local corrections.
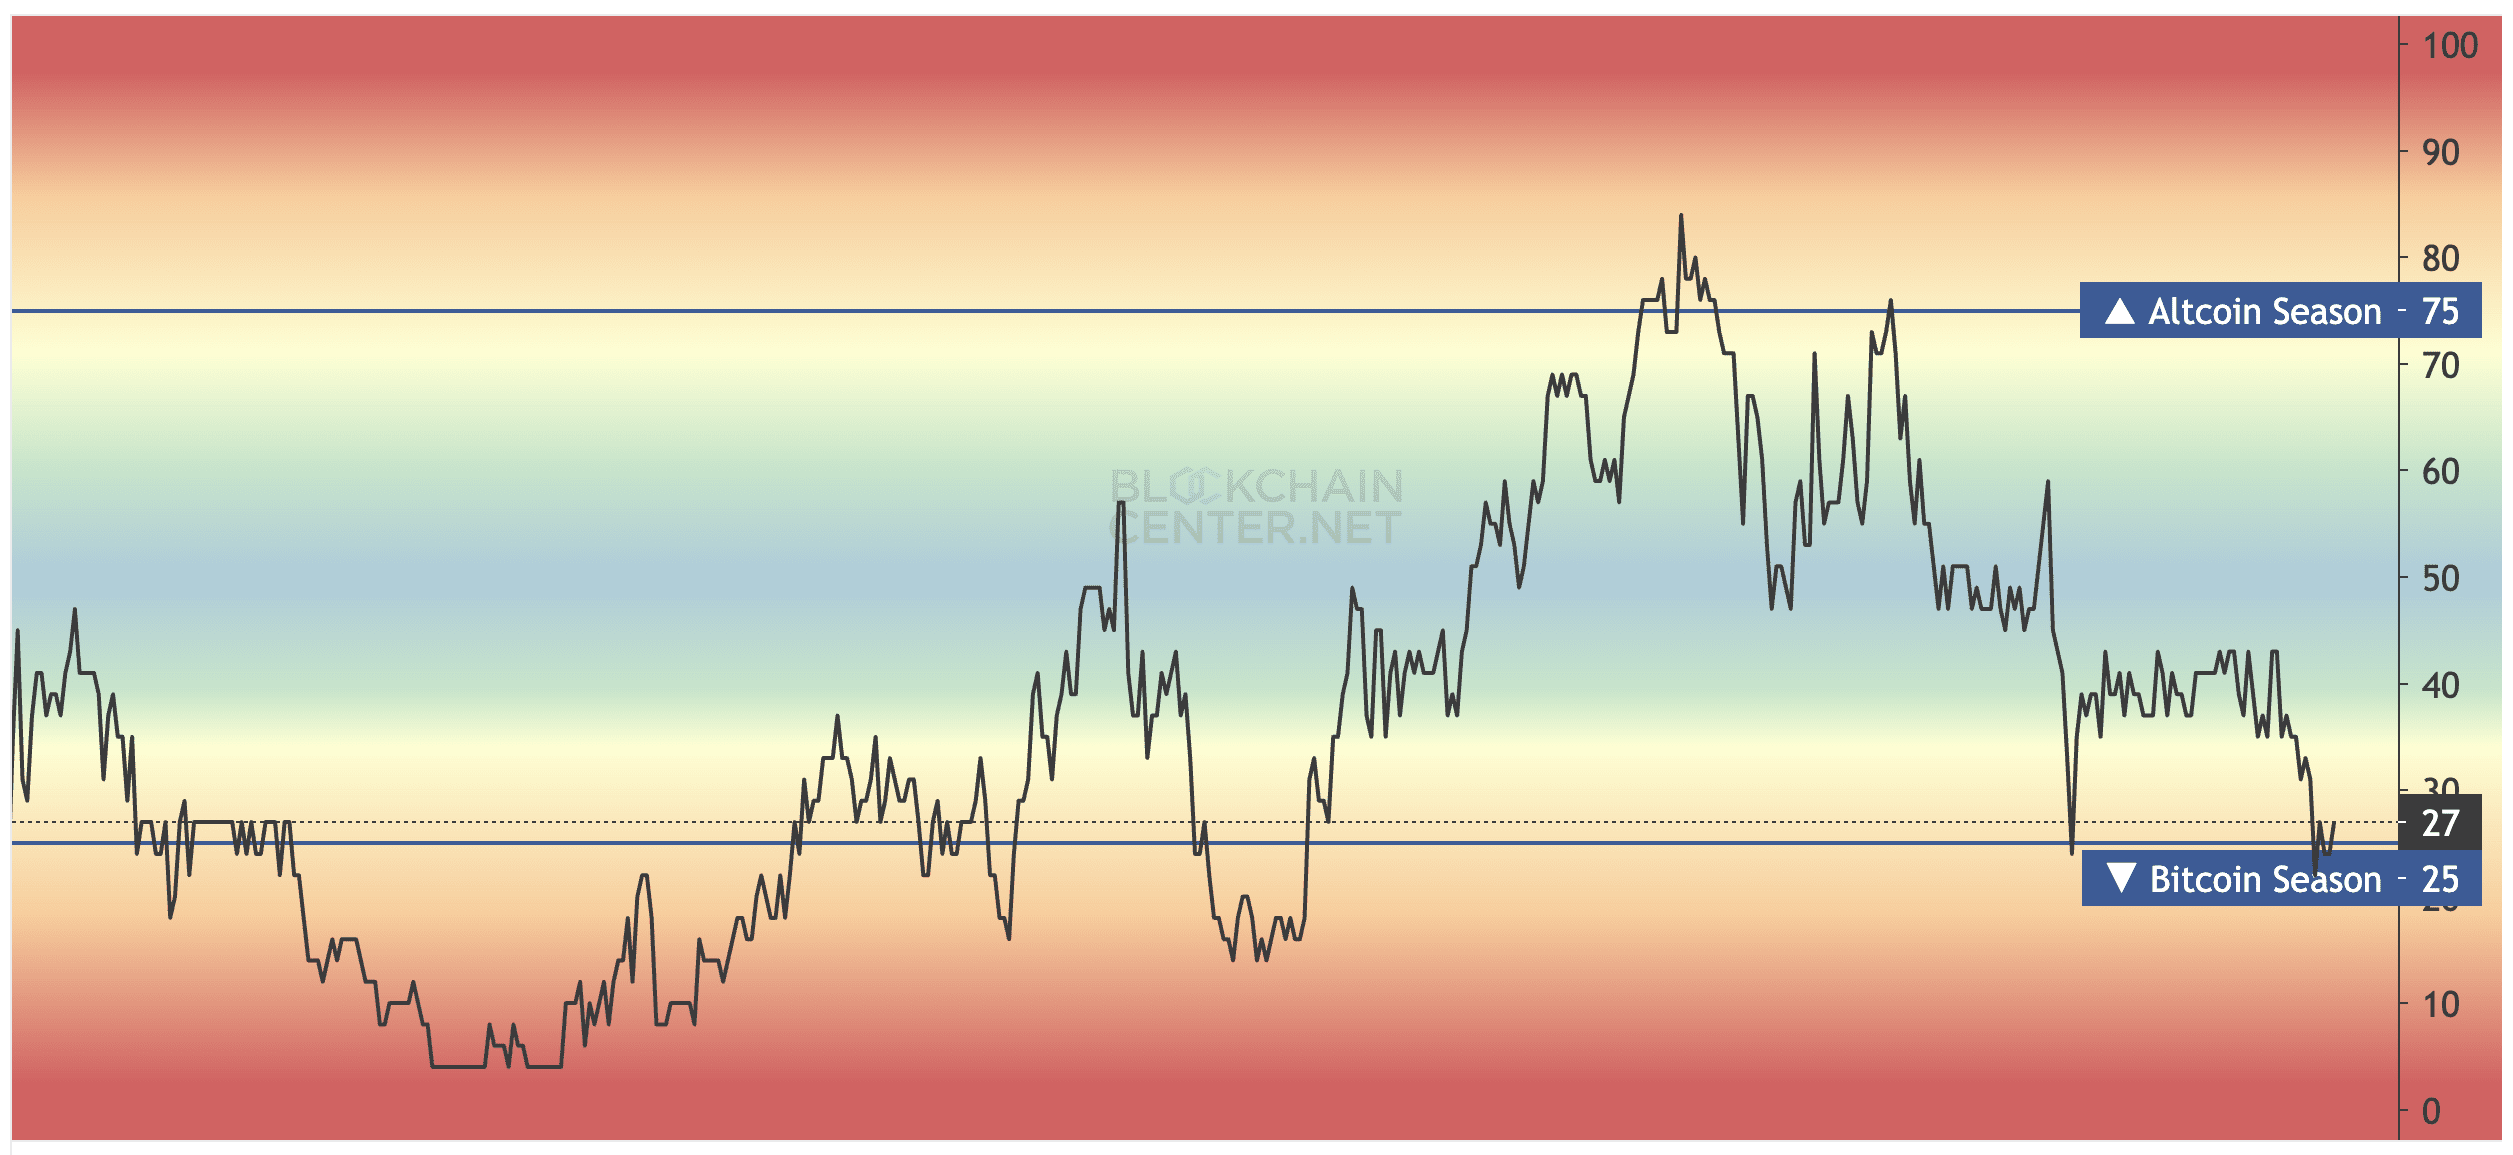
Altcoin Season Index. Source: blockchaincenter.net
The Fear and Greed Index has not undergone significant changes and is at 72 points, categorized as "Greed." This suggests that traders are reluctant to sell their holdings, indicating a strong appetite for risk in the current market environment.
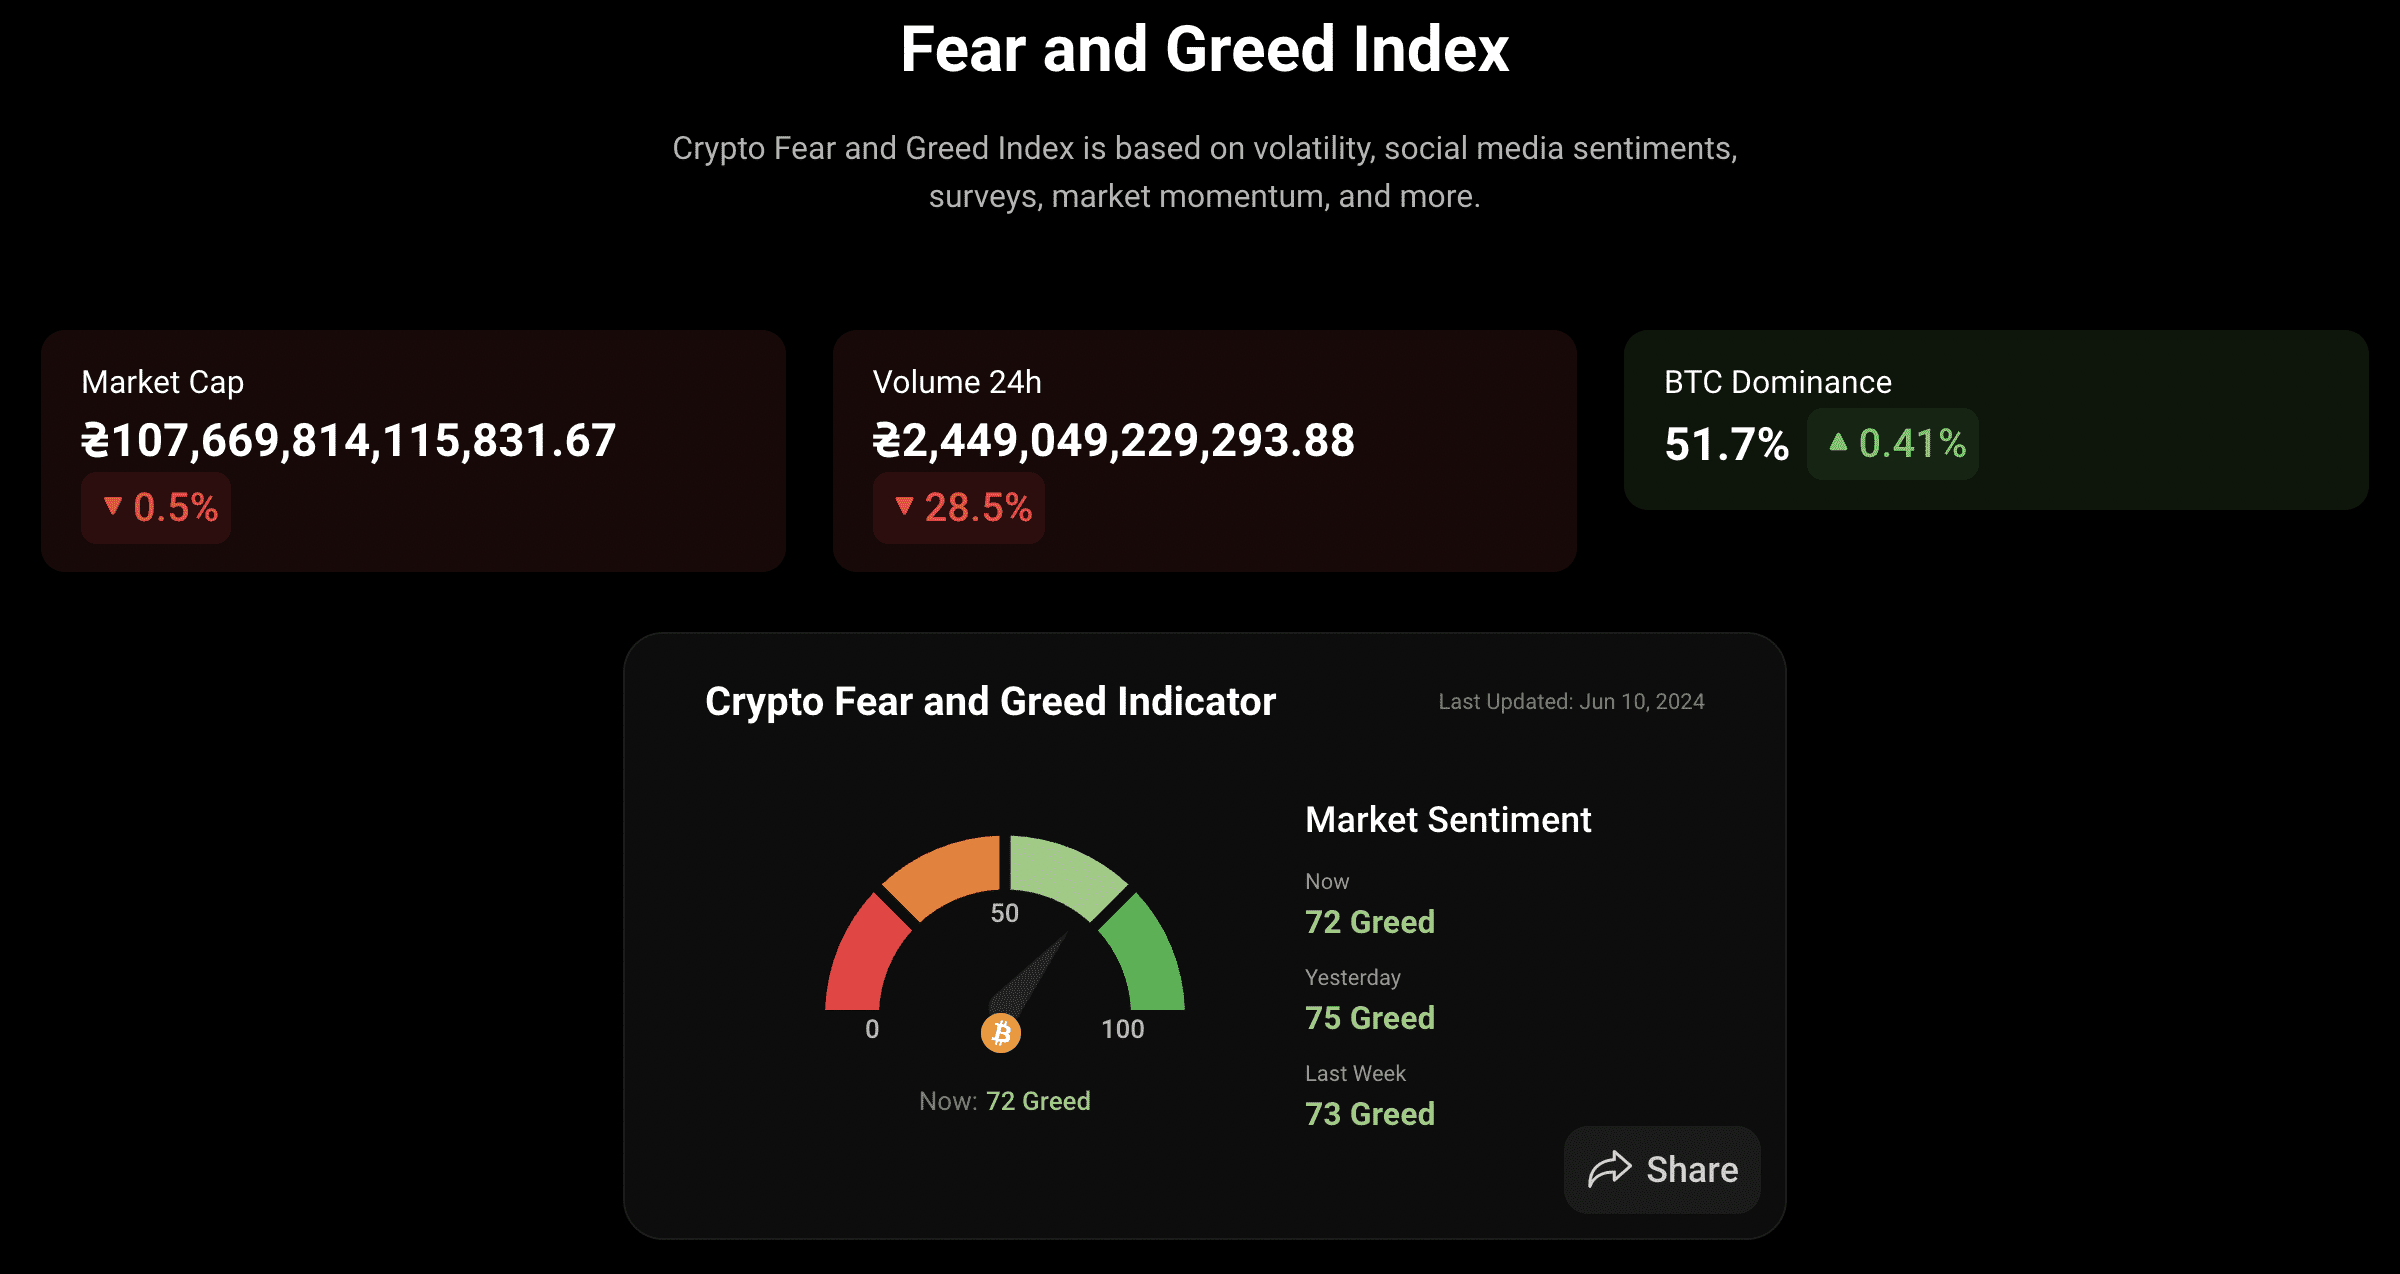
Fear and Greed Index. Source: coinstats.app
Economic News
This week's macroeconomic landscape will be shaped by several key reports and decisions:
- The U.S. Consumer Price Index (which determines the inflation level), crude oil inventories, and the Fed's decision on interest rates (Wednesday, June 12);
- The number of initial unemployment insurance claims and the Producer Price Index (Thursday, June 13);
- The Federal Reserve's report on monetary policy (Friday, June 14).
Check out GNcrypto for the latest cryptocurrency rates and chart analysis.
Disclaimer
Please note that the analysis provided above should not be considered a trading recommendation. Before opening any deals, we strongly advise conducting your own research and analysis.
Abbreviations
TF (Timeframe) — a chronological period equal to the time it takes to form one Japanese candle on the chart.
Horizontal channel (flat, sideways, range) — the price movement between support and resistance levels, without going beyond the given range.
К — simplified designation of one thousand dollars of the asset price (for example, 23.4K – $23,400).
Gray range on the chart — a support zone.
Red range on the chart — a resistance zone.
Correlation — the tendency of prices of different cryptocurrencies to move in sync, often influenced by the dominance of one of the assets.
Initial materials
This analysis was informed by the following educational materials and articles from GNcrypto:


Recommended