The crypto market saw a peaceful weekend, with no notable spikes in volatility. Let's examine the market situation for Bitcoin (BTC) and Ethereum (ETH).
Bitcoin (BTC)
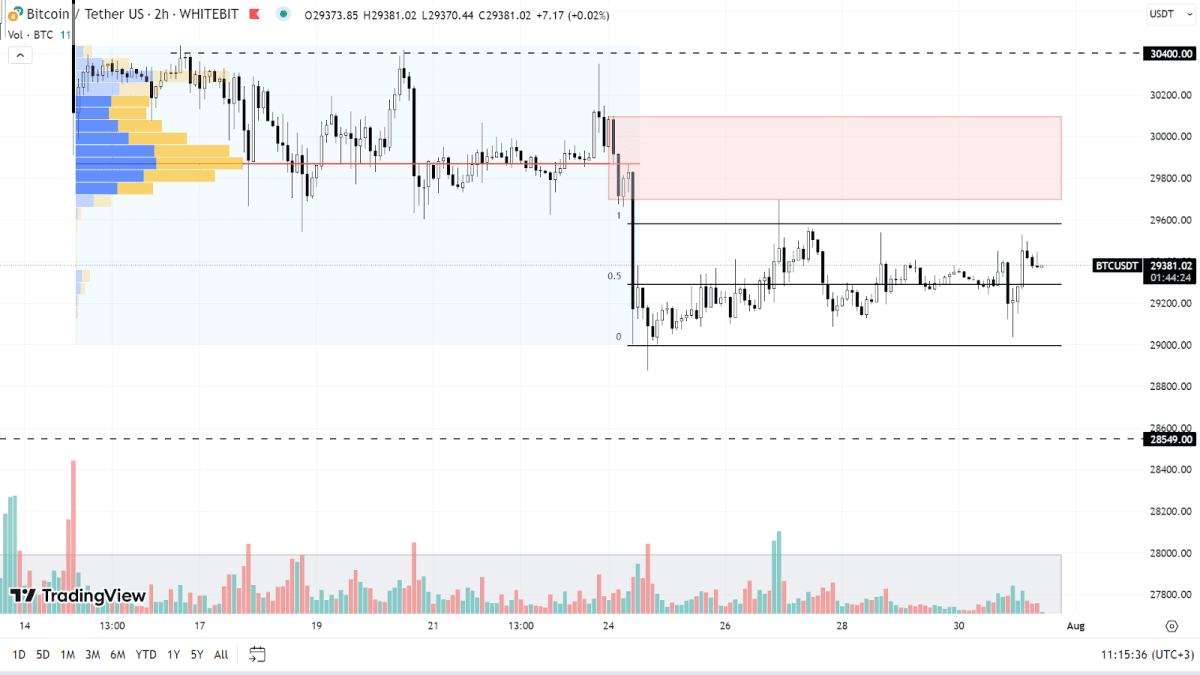
Over the weekend, Bitcoin continued to trade sideways within the support level of $29,000 and the resistance level of $29 600. Notably, the attack on the Curve platform, which led to a loss exceeding $50 million, didn't sway the market trajectory of the main cryptocurrency.
The upward trend remains ongoing, yet there is still room for further correction and a possibility for a new local low. In this scenario, we could potentially see buying orders emerging around the $28,500 mark and within the $26,700-$28,000 zone. As long as the asset's price remains above the psychological threshold of $25,000, we can anticipate the bullish trend to persist.
For Bitcoin's upward trajectory to continue, it must break through the resistance zone between $26,700 and $30,100, and establish itself above the $30,400 mark. However, this upward shift must be complemented by significant trading volumes; otherwise, any bullish price movement might be nullified by aggressive selling.

BTC chart on the H2 timeframe
Ethereum (ETH)
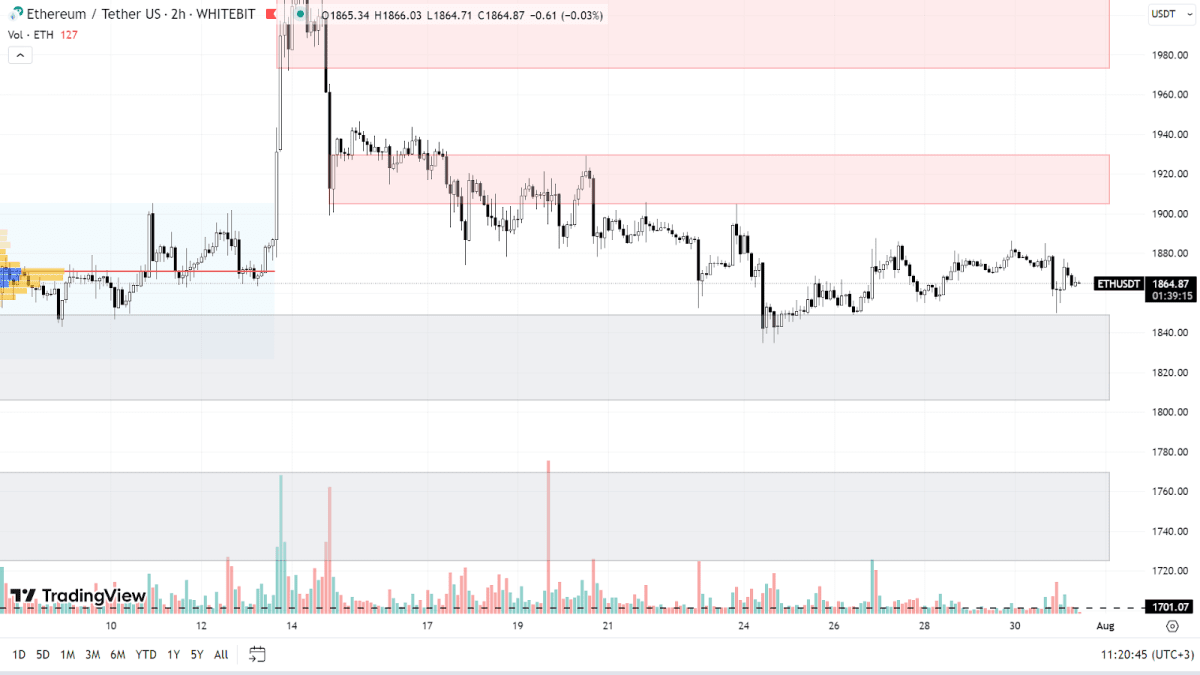
Over the weekend, ETH maintained a relatively stable trajectory. The asset's price continues to oscillate between the support range of $1,805-$1,850 and the resistance zone of $1,905-$1,930. If the buying pressure mounts, ETH could reach a fresh local high above the $1,973-$2,026 range.
The asset still maintains a strong correlation with the BTC price movement. Should the correction continue, ETH could drop to test the $1,725-$1,770 support zone and the buyer's level at $1700.

ETH chart on the H2 timeframe
Yesterday, Bitcoin's volatility index reached a fresh low, slipping below the 0.33 mark for the first time since January 7. The last time this happened, Bitcoin experienced an explosive increase, jumping from $16,000 to $25,000 in a single month.
Moving forward, it wouldn't be surprising to see a dramatic uptick in Bitcoin's volatility, resulting in a sudden shift in the asset's price in either direction. Consequently, anyone considering new trades should tread carefully.
Check out GNcrypto for the latest cryptocurrency rates and chart analysis.
Disclaimer
Please note that the analysis provided above should not be considered a trading recommendation. These are solely the opinions of the GNcrypto editorial board regarding the market situation. Before opening any deals, we strongly advise conducting your own research and analysis.
Abbreviations
TF (Timeframe) — a chronological period equal to the time it takes to form one Japanese candle on the chart.
Horizontal channel (flat, sideways, range) — the movement of price between support and resistance levels, without going beyond the given range.
К — simplified designation of one thousand dollars of the asset price (for example, 23.4K - $23,400).
Gray range on the chart — a support zone.
Red range on the chart — a resistance zone.
Correlation — the tendency of prices of different cryptocurrencies to move in sync, often influenced by the dominance of one of the assets.
Initial materials
This analysis was informed by the following educational materials and articles from GNcrypto:

